Case Study: Feature Demand Testing with Tiny Acquisitions SaaS Platform
How Tiny Acquisition validated a feature that is currently in development by turning it on and gathering demand data.


❗️WIP ❗️ - This is a work in progress document
Use case: Feature Demand Test
Website: https://tinyacquisitions.com/
Team size: 3
Company Stage: PMF > 8% growth MRR
Industry: M&A
Vertical: SaaS Marketplace
Technology Platform: Bubble
Tiny Acquisition is a marketplace for small companies, products or tools to be acquired for less than USD 100k.
🤔 Problem
They received a feature request from a user that they wanted to be notified whenever a startup goes on sale within a specific pricing range and community size.
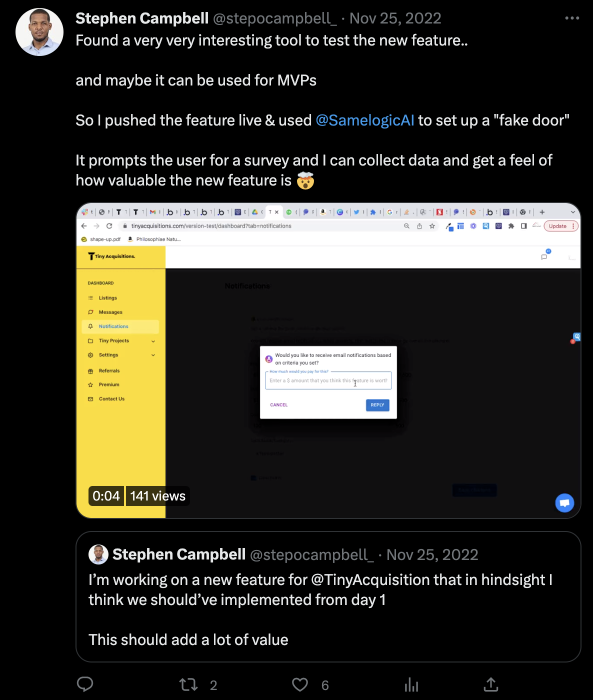
Development had already started when they learned of the concept testing method and available tooling. When they learned of Samelogic, they launched the feature early without functionality to see who else would be willing to use it.
Note: This is similar to but opposite of a dark launch, except that the feature is shown to the user without functionality, but an in-app dialog will explain what we are doing and how to help us build the feature better for you.
📊 Outcomes
Since the feature already had a significant investment, we will measure a few things:
Usage Prediction: The feature will be shown to the users where we will collect the impressions and some qualitative survey data on what the user is trying to accomplish.
Cohort Analysis: We collect sessions or user IDs to correlate who interacted with the concept and what they said. This way, we can know who to retarget with notifications and request interviews for those who want to participate.
🧙♀️ Personas
All of the personas involved in conducting this test:
Stephen Campbell: Founder - Full Stack Bubble Developer
🧪 Methods
Planning and Design
The feature will be accessed through a navigation item on the dashboard side panel.
Before:

After:

Video recording of how it should look in production:
The "Notifications" button will navigate to a nonfunctional page with a microsurvey overlay, asking for more information.
Measuring
Our test will measure two things:
Click-through rates (CTR), which is the percentage of users who clicked the feature out of all the users who saw it. This will give us an idea of how many people are interested in the feature.
Survey responses, which contain questions we need to ask the user to learn something more about why they are clicking the feature. In this case, we want to know if users will pay extra to use this feature.
Execution
1. Stephen copied the Samelogic code snippet into the `<head>` section of the website using Bubble's "Shared Technical Settings" feature.
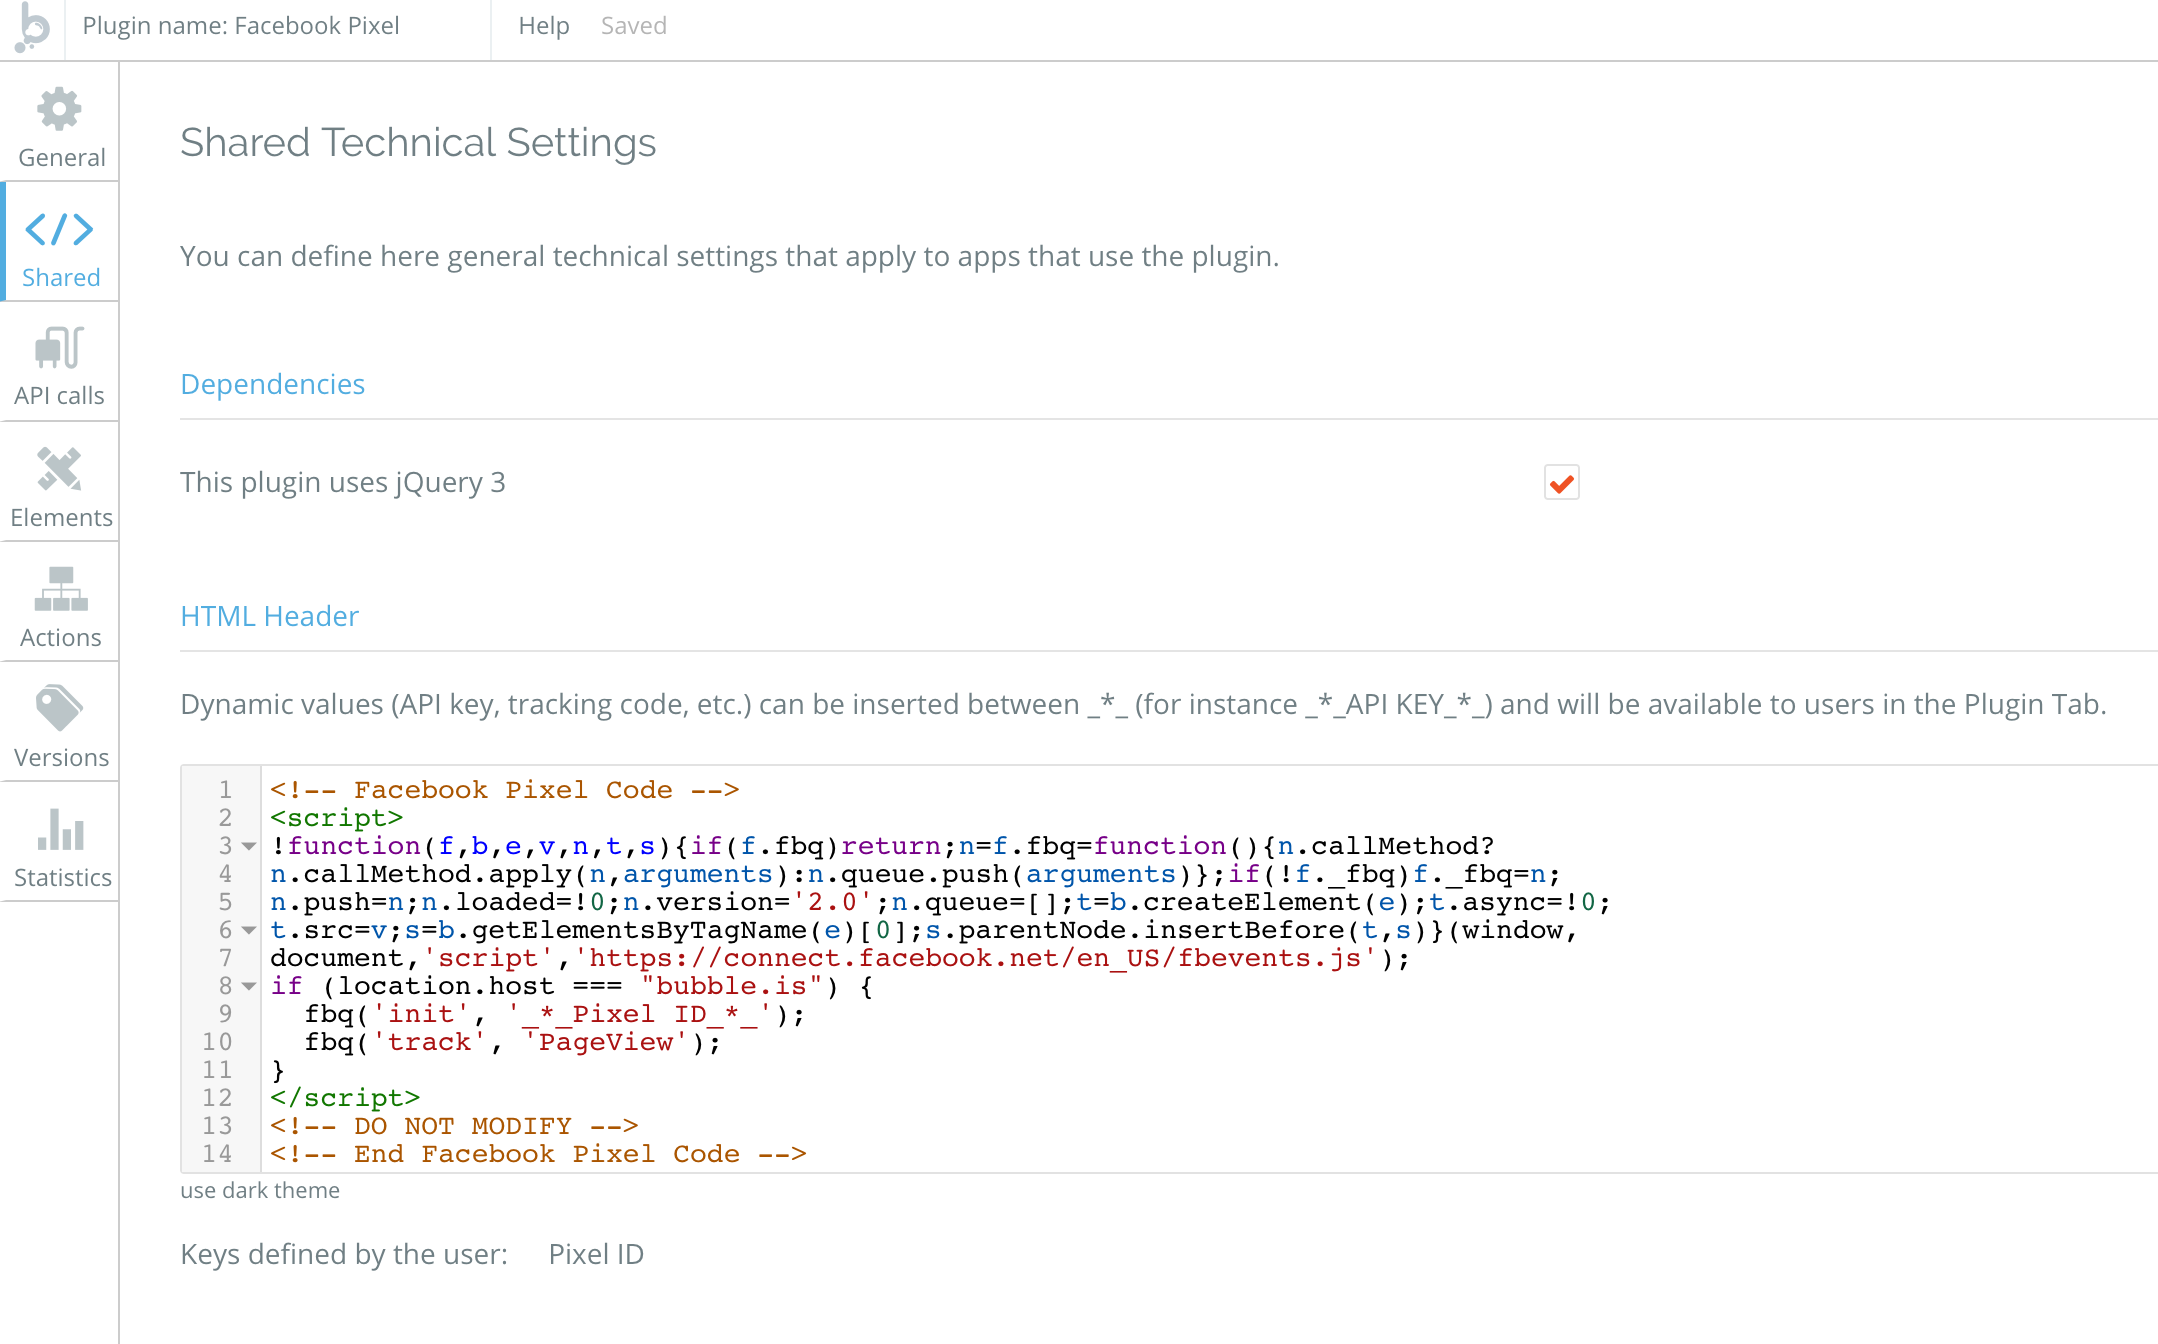
Documentation can be found here.
2. He used Bubble to add the navigation item "Notifications."
3. Samelogic was used to instrument the navigation item using the chrome developer tools to find its CSS selector.
4. A research was created in the Samelogic's dashboard, and the CSS selector is used to instrument the UI component and trigger the Microsurvey when clicked.

Note: A chrome extension powered by AI is now available to both design the nav item and instrument it without needing to set this up in the dashboard. You can test out the alpha here.
5. The microsurvey was then configured with the appropriate questions:
The default Microsurvey styling remained.
6. The identity variable was setup by configuring Bubble to expose an attribute to the window object that represented the user. This way, we can correlate all user events to some hard user name or email in the backend.
An identity variable in Bubble can be exposed to the window object using the toolbox plugin's run javascript behavior when a user is logged in.

In Samelogic, this is set at the bottom of setting up the concept intelligence:

When an event is fired, such as when the concept is `viewed`, `hovered`, or `clicked`, and the survey events, such as `submitted` or `canceled`, are fired, they all come with the identity.
These events could be piped off to another system using Zapier for further analysis.
✅ Setup Time: 30 minutes
📈 Test Results
The test was run for four days until the feature's development was completed and a full rollout occurred.
This is what their dashboard looked like:

The time series data pulled from Metabase looked like this:

This time series shows that the interest in the feature fell off over time.
Analysis
Adjusting for test/development data, the CTR is less than 5%, with less than a 1% response rate at about 500 impressions across four days.
The fall off of the clicks could be due to users already participating in the test, knowing it's not ready yet, so they are not interacting with it.
The survey response contained the user id of the logged-in user who responded to the survey. This was used to correlate with the users Stephen has been talking to, so further information can be gathered.
The test showed that the feature might not take off with many users, except the one who requested it to be built.
❤️ Product Results
The feature was launched four days later, and users were alerted by email of the new feature.
Time spent building the feature:
How many users are using it three months later?
⚡️Conclusion
The test and the actual usage correlated.
Related workflows
Move from editorial context into the selector, Playwright, and bug-reproduction pages that turn exact UI evidence into action.