Fake Door testing our Amplitude Integration on LinkedIn

If you’re a UX or Product Manager or even an Engineer, you’ve probably been in a situation that required you to build out a product, feature, or concept that you weren’t sure was going to ultimately work.
It was not until you spent copious amounts of time, money and manpower that you were able to get a good read on whether or not your product or idea was even viable or even beneficial to your users. What if you could save most of that time and effort by finding out what your users want before building?
This is why we doubled down on fake door tests. Samelogic helps you run In-Product Fake Door Tests and we also use this process to determine what features to build in the product itself. Great dogfooding opportunity.
We will walk through how we market validate which integrations to build next using fake door testing via LinkedIn Ads. This method can work for any ad platform.
What are fake doors?
An In-Product Fake Door Test is a validation technique that requires minimal effort to get hard evidence of demand and intent for an idea. It is popular among teams who need to operate lean because of how cheap it is to get unbiased evidence.
Fake Doors consists of placing a non-functional mockup in the product and showing it to a specific set of users, analyze who interacts with it, collect some feedback, and use data to decide if the idea should be invested in more.
How In-Product Fake Doors Tests are done
Let us walk through how fake door testing work without Samelogic.
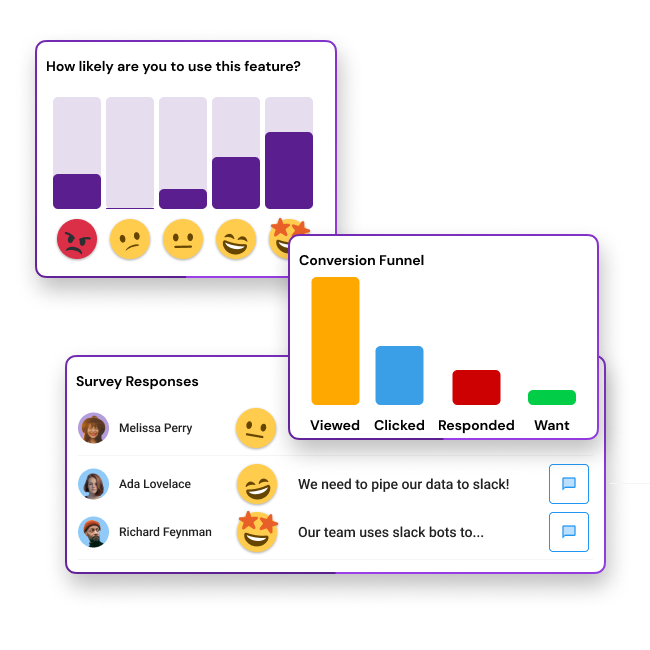
When product teams run in-product fake door tests to validate feature ideas, they usually collect 2 things:
Quantitative Analytics such as conversion rate
User Feedback such as triggering a survey.
To conduct these tests, we need to work across a few toolsets:
A design system or repository of components matching the brand and style of the product.
A survey tool such as Sprig or Typeforms for collecting and analyzing feedback.
An analytics tool, which is referred to as Customer Data Platforms (CDP) such as Segment or Amplitude.
Design Systems such as Figma, Sketch, Storybook are used to store components. Most components needed for fake door tests are already done, it is just a matter of the developer re-using them.
Customer Data Platforms (CDP) such as Segment or Amplitude can pull in data from the product, support, marketing, and many other tools to get a full picture understanding of the acquisition funnel and product usage.
A User Research tool such as Sprig or Typeforms can be used for collecting user feedback to understand why they are interacting with the fake door.
Lean product teams rely heavily on dashboards that show user behavior with additional information such as their plans, company size, and many other attributes critical to understanding who the users are. But qual and quant tools are separate, so teams needs to be looking at multiple dashboards.
Deep Dive into the setup process
Let's do a deep dive into what a Product Manager usually does to execute this test.
1. Estimate Effort
Who is involved?
PM
Engineering
UX
The first thing before getting to this test is to discuss estimates with the team, especially engineering and UX. We want to ensure that the overhead of setting up a fake door test is not greater than just building the feature.
2. Brainstorm Mock
Who is involved?
PM
UX
Since the UX is at the front of the funnel where the users interact directly with their work, they will know the best design and placement of the mock. This mock will be the entry point to the feature.
3. Build the Mock
Who is involved?
UX
A mock is usually done in the design system of choices, such as Figma, Invision, Sketch, or Storybook. This mock is then handed off to the developer.
4. Developer Handoff
Who is involved?
UX
Engineer
Some design systems like Figma can generate code for the developer to implement. But this is a very clunky process and depends heavily on how engineering is building its front end.
5. Developer Implementation
Who is involved?
Engineer
The developer has to implement the fake door test with a few steps:
Place the mock in the product.
Wire-up tracking, such as sending click events to the CDP.
Wire up the click event. Some PMs will want to:
Show a pop-up that tells users the feature is coming soon.
Collect some feedback by showing a microsurvey.
Linking out to an external product feedback tool.
Build their own forms.
After development, the engineering team usually goes through a series of testing and code review iterations which can take hours or days depending on how rigorous their processes are.
6. Measure and Learn
Who is involved?
PM
UX
The product team will measure the conversion rate, which is how many people were shown the fake door and how many people clicked it. They have to view this across multiple tools since Quant is sent to the CDP and Qual is sent to another research tool.
Why do we need Amplitude?
Samelogic helps the Product Manager or UX to cut out almost all of this process and allows you to drag a component straight out of your design system and into the website, with all of this work instrumented for you.
Some of our early users are using Amplitude, Segment, and Heap as their CDP and would like to pipe the conversion rate and survey responses into these tools. While we provide the analytics on our dashboard, our users want to view deeper insights into what users were doing before and after the experiment and who they are.
So while we have users asking for this, we need to actually test the market demand.
Validating at the market level
We are a Product-led company, meaning that our customer acquisition is mostly coming through marketing channels such as digital ads, social media, podcasts, and SEO instead of direct sales. This sends them to our landing pages where we are measuring a call to action (signups).
Part of our funnel looks like this:
social media post > landing page > signup > feature usage
New product features should be bringing in more users, therefore we need to experiment with the whole funnel before building anything.
Social media and ads are the most easily manipulated sources, so it is the easiest to validate from.
Why LinkedIn?
We have 3 main networks where our audiences are; Facebook, Twitter, and LinkedIn.
We have experimented with copy and imagery for our core value proposition by running ads on all platforms. Our key metric is called the Click Through Rate (CTR) and Cost Per Click (CPC). We want a high CTR and a low CPC.
So far, our highest performing network is LinkedIn with a CTR of 1-2%. Platforms like Twitter and Facebook gave us 0.1-1.5%.
Funnel Design
Although our Amplitude integration works, we needed to exercise the first part of the playbook for the rest of the integrations.
Our goal for this experiment is to funnel some people from our audience who are not our followers into our landing page and measure who signs up.
This tells us a few things:
Our messaging makes sense.
Our landing conveys the right information to convert.
We need to measure existing followers from new users because most of our followers already know what we’re building.
Some fake doors can be run as just ads without the need for the landing. But in this case, we are measuring the full funnel. We want them to convert AND use the feature.
Setup Process
The first thing we did was to iterate on our landing page. We are using contentful, gatsby, and netlify for our landing tech stack. This allows us to iterate on hard-coded things before making them generic and using contentful to store the data.
Our integrations are stored in contentful along with our blogs and soon to be our podcasts.
The next step was to iterate on some LinkedIn messaging and imagery amongst our friends.
We’ve learned that we can leverage open graph’s properties. Once we set this up on the landing, all we have to do is figure out a copy/message to share with the link.
The link must also contain UTM sources, this is how we can tell which network and which post is driving the traffic. Since we post across 3 networks, we need to generate 3 separate URLs and copy.
We had dashboards set up in heap analytics to track these sources, the funnels, and CTA.
Executing the Funnel
When we have all of this plan, we start posting. On LinkedIn, we will boost the post to our most likely audience for Amplitude users who are in Product and UX roles.
An example of this post can be found here. We don’t care about engagements or likes, we are seeking hard empirical evidence that there is some interest for this integration.
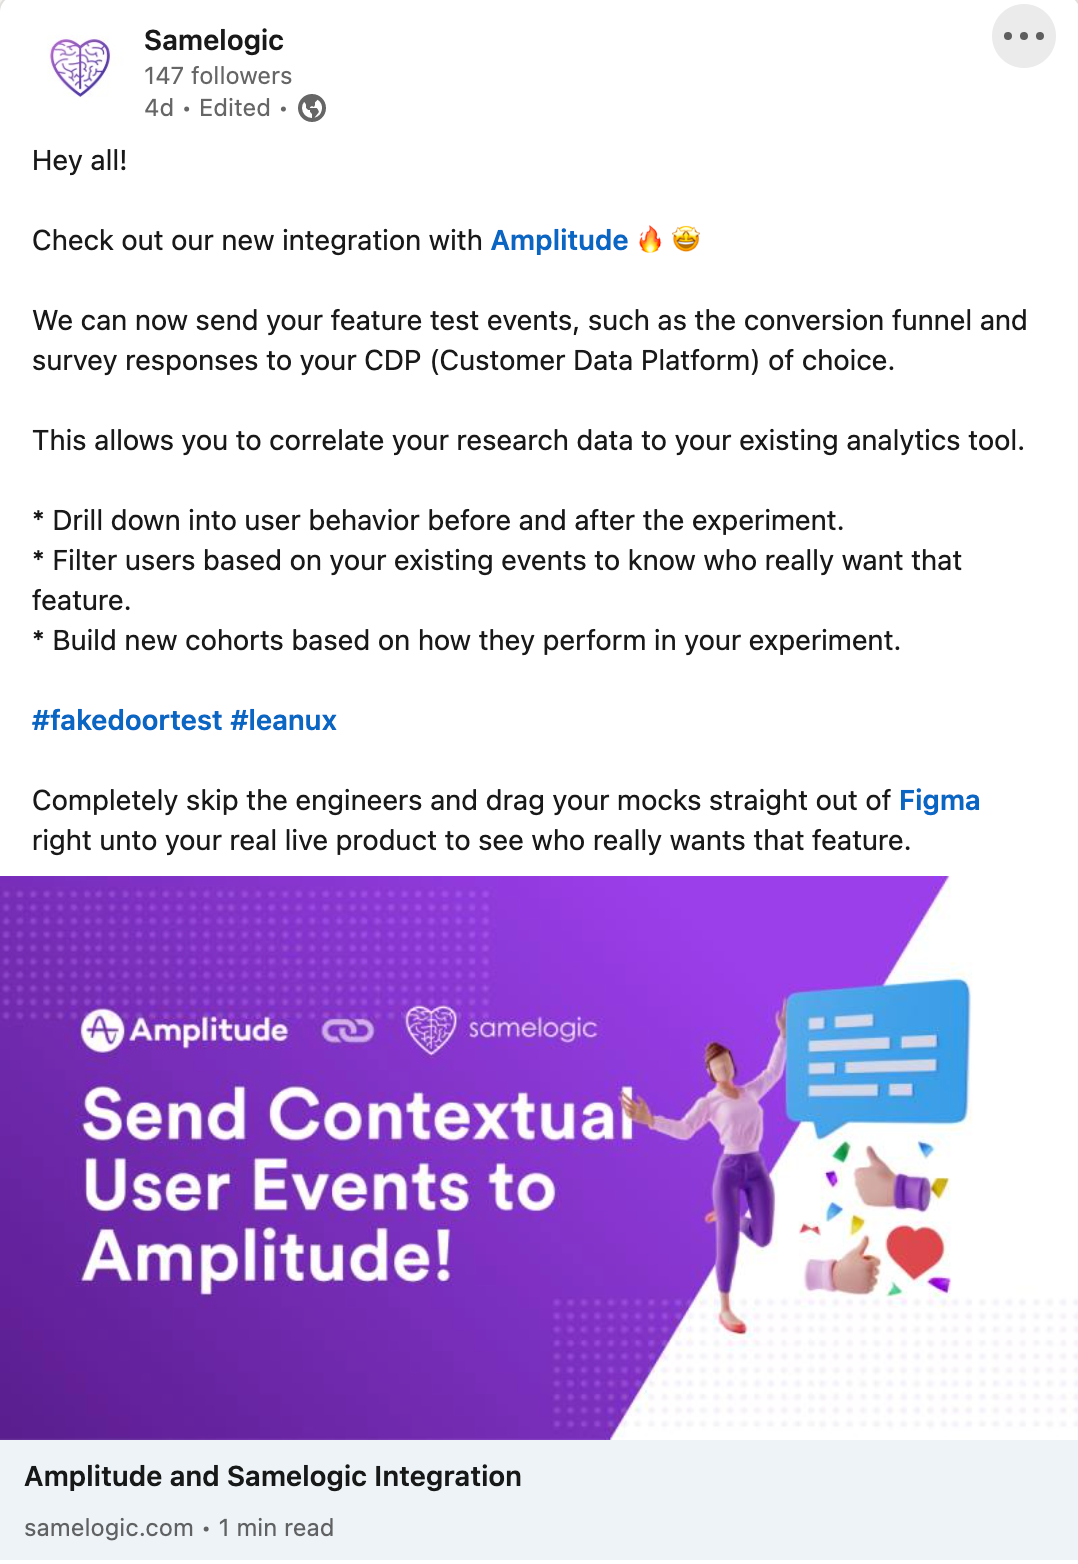
What our post looks like.
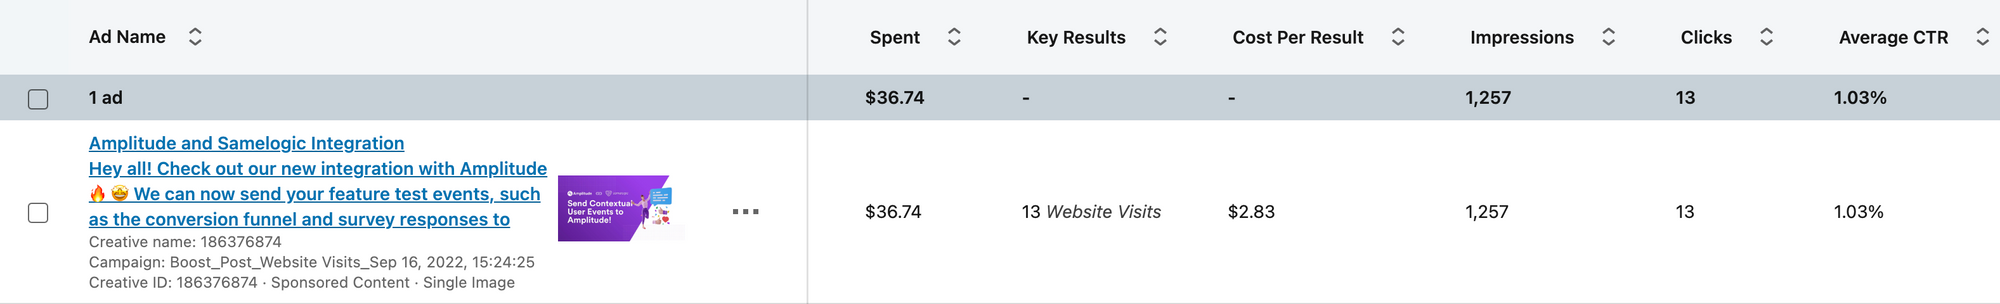
Analyzing the Data
The first place to check is the LinkedIn Ad campaign data. Looking at the image below, we see that we spent $37 for 13 views.
In our heap dashboard, we can see this correlation with some discrepancies of having 16 visitors.
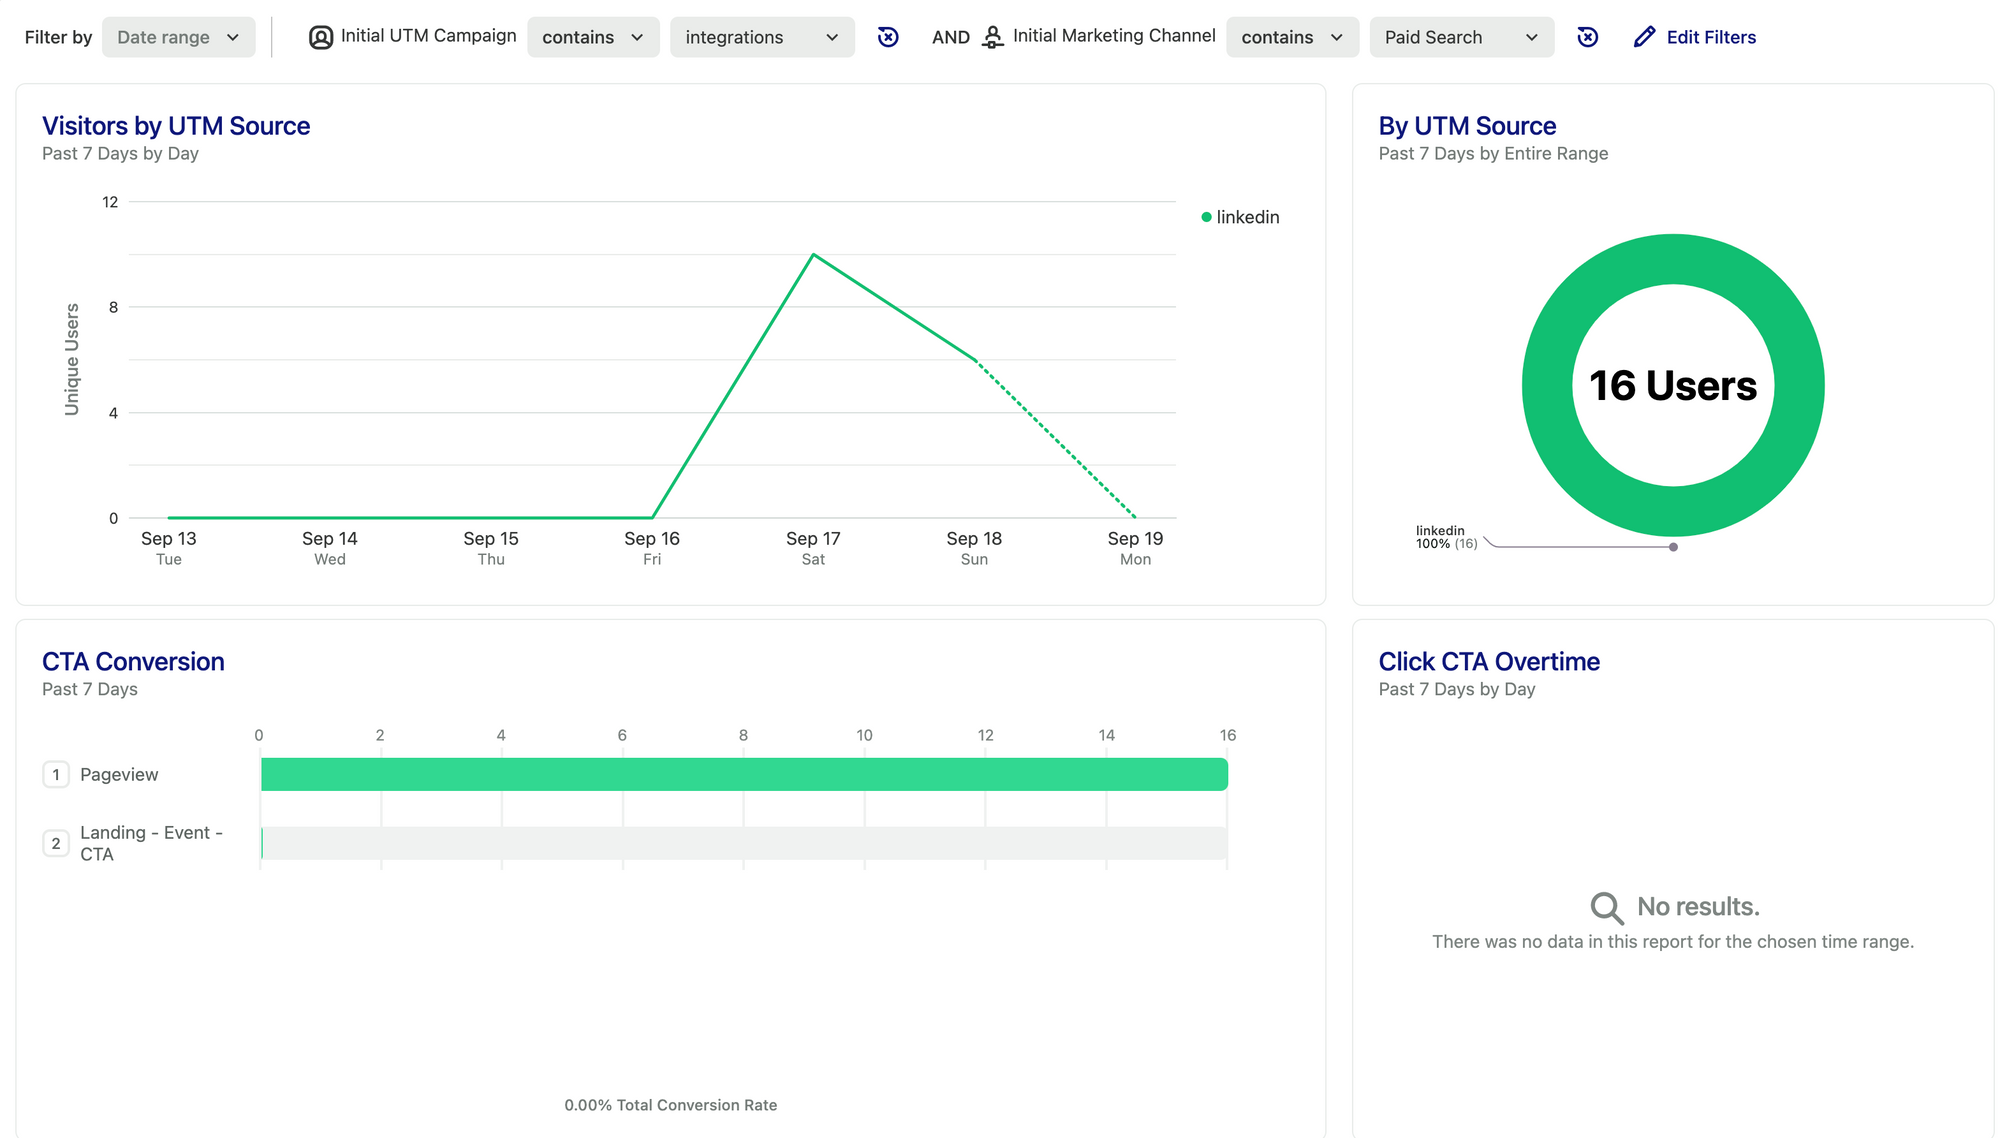
In this version for both paid and organic, we got 41 visitors total.
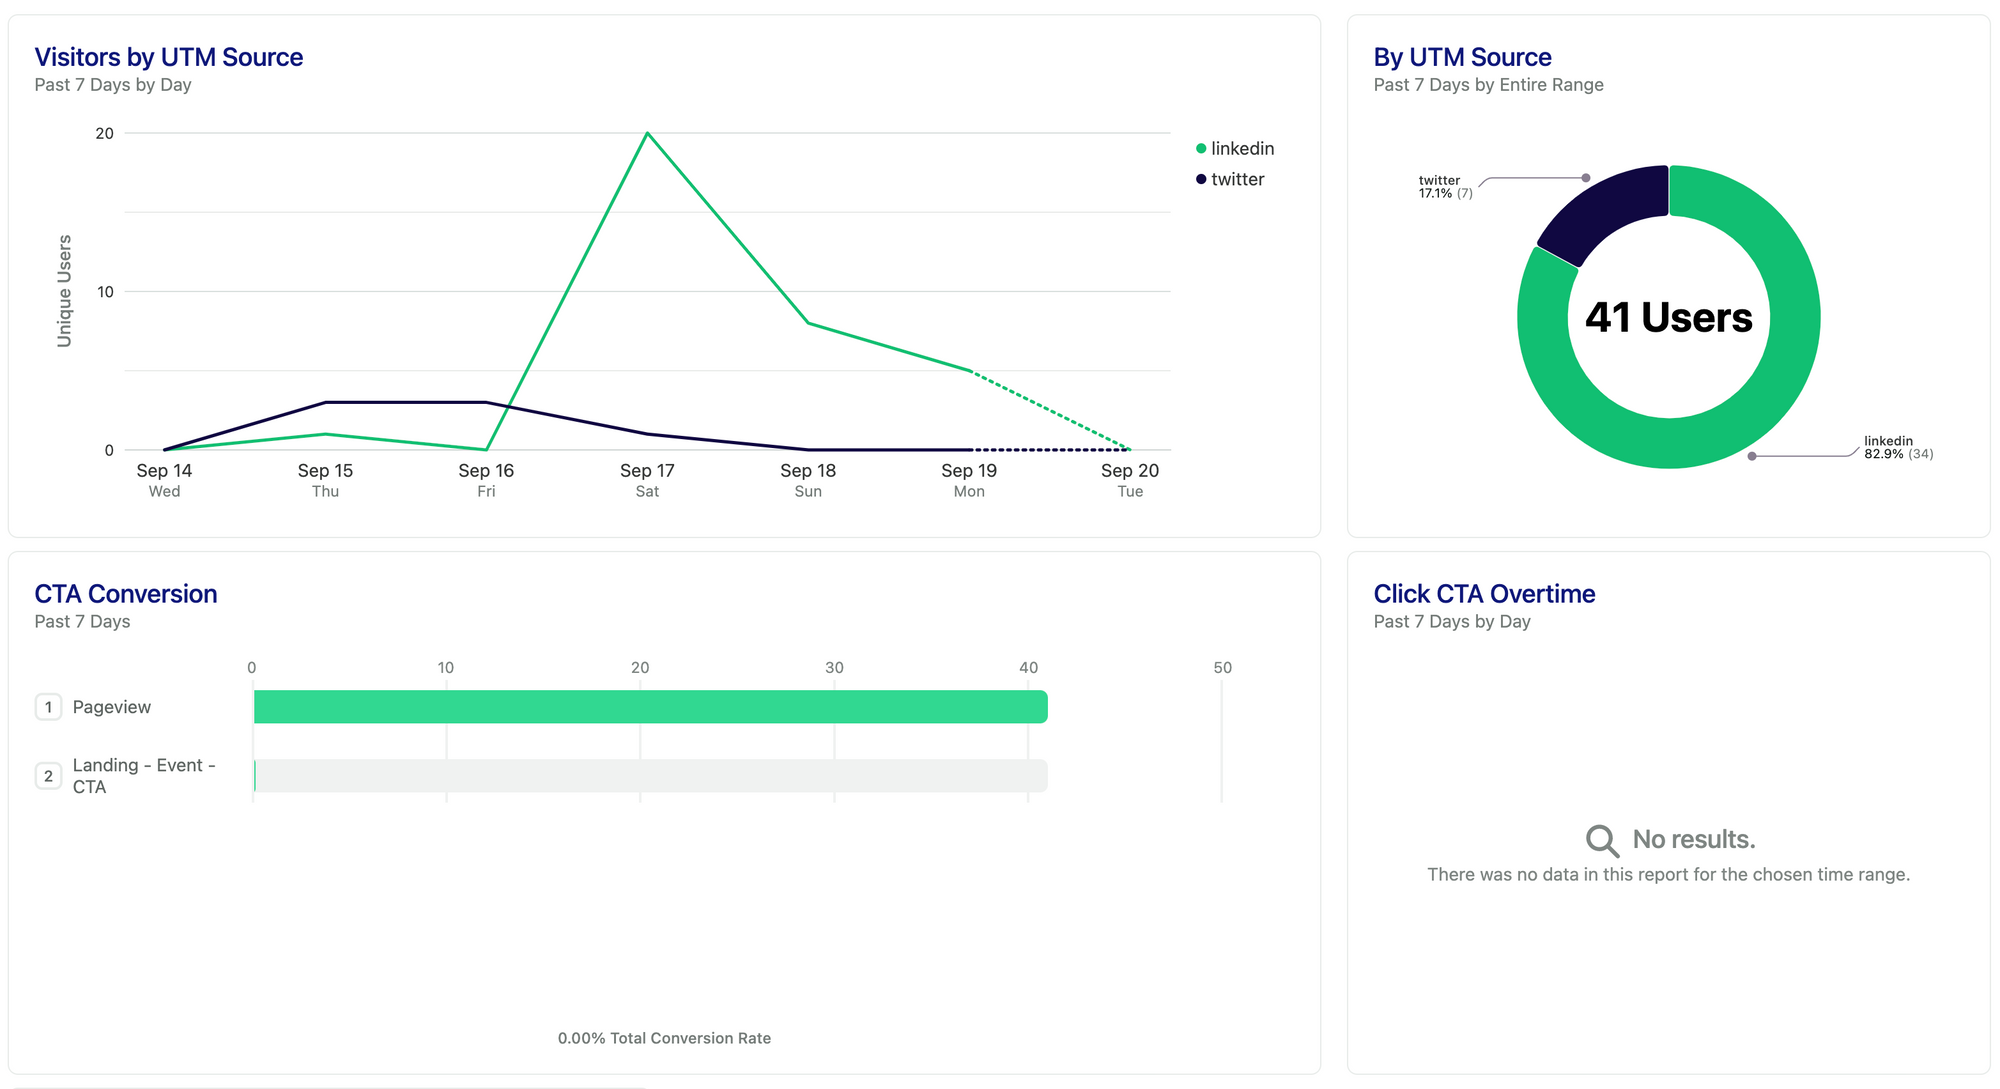
But the main thing that stood out to us is that nobody really spent time on the landing page nor clicked the CTA. If 41 people clicked the link, then it must mean we need to work on the hero section of our landing.
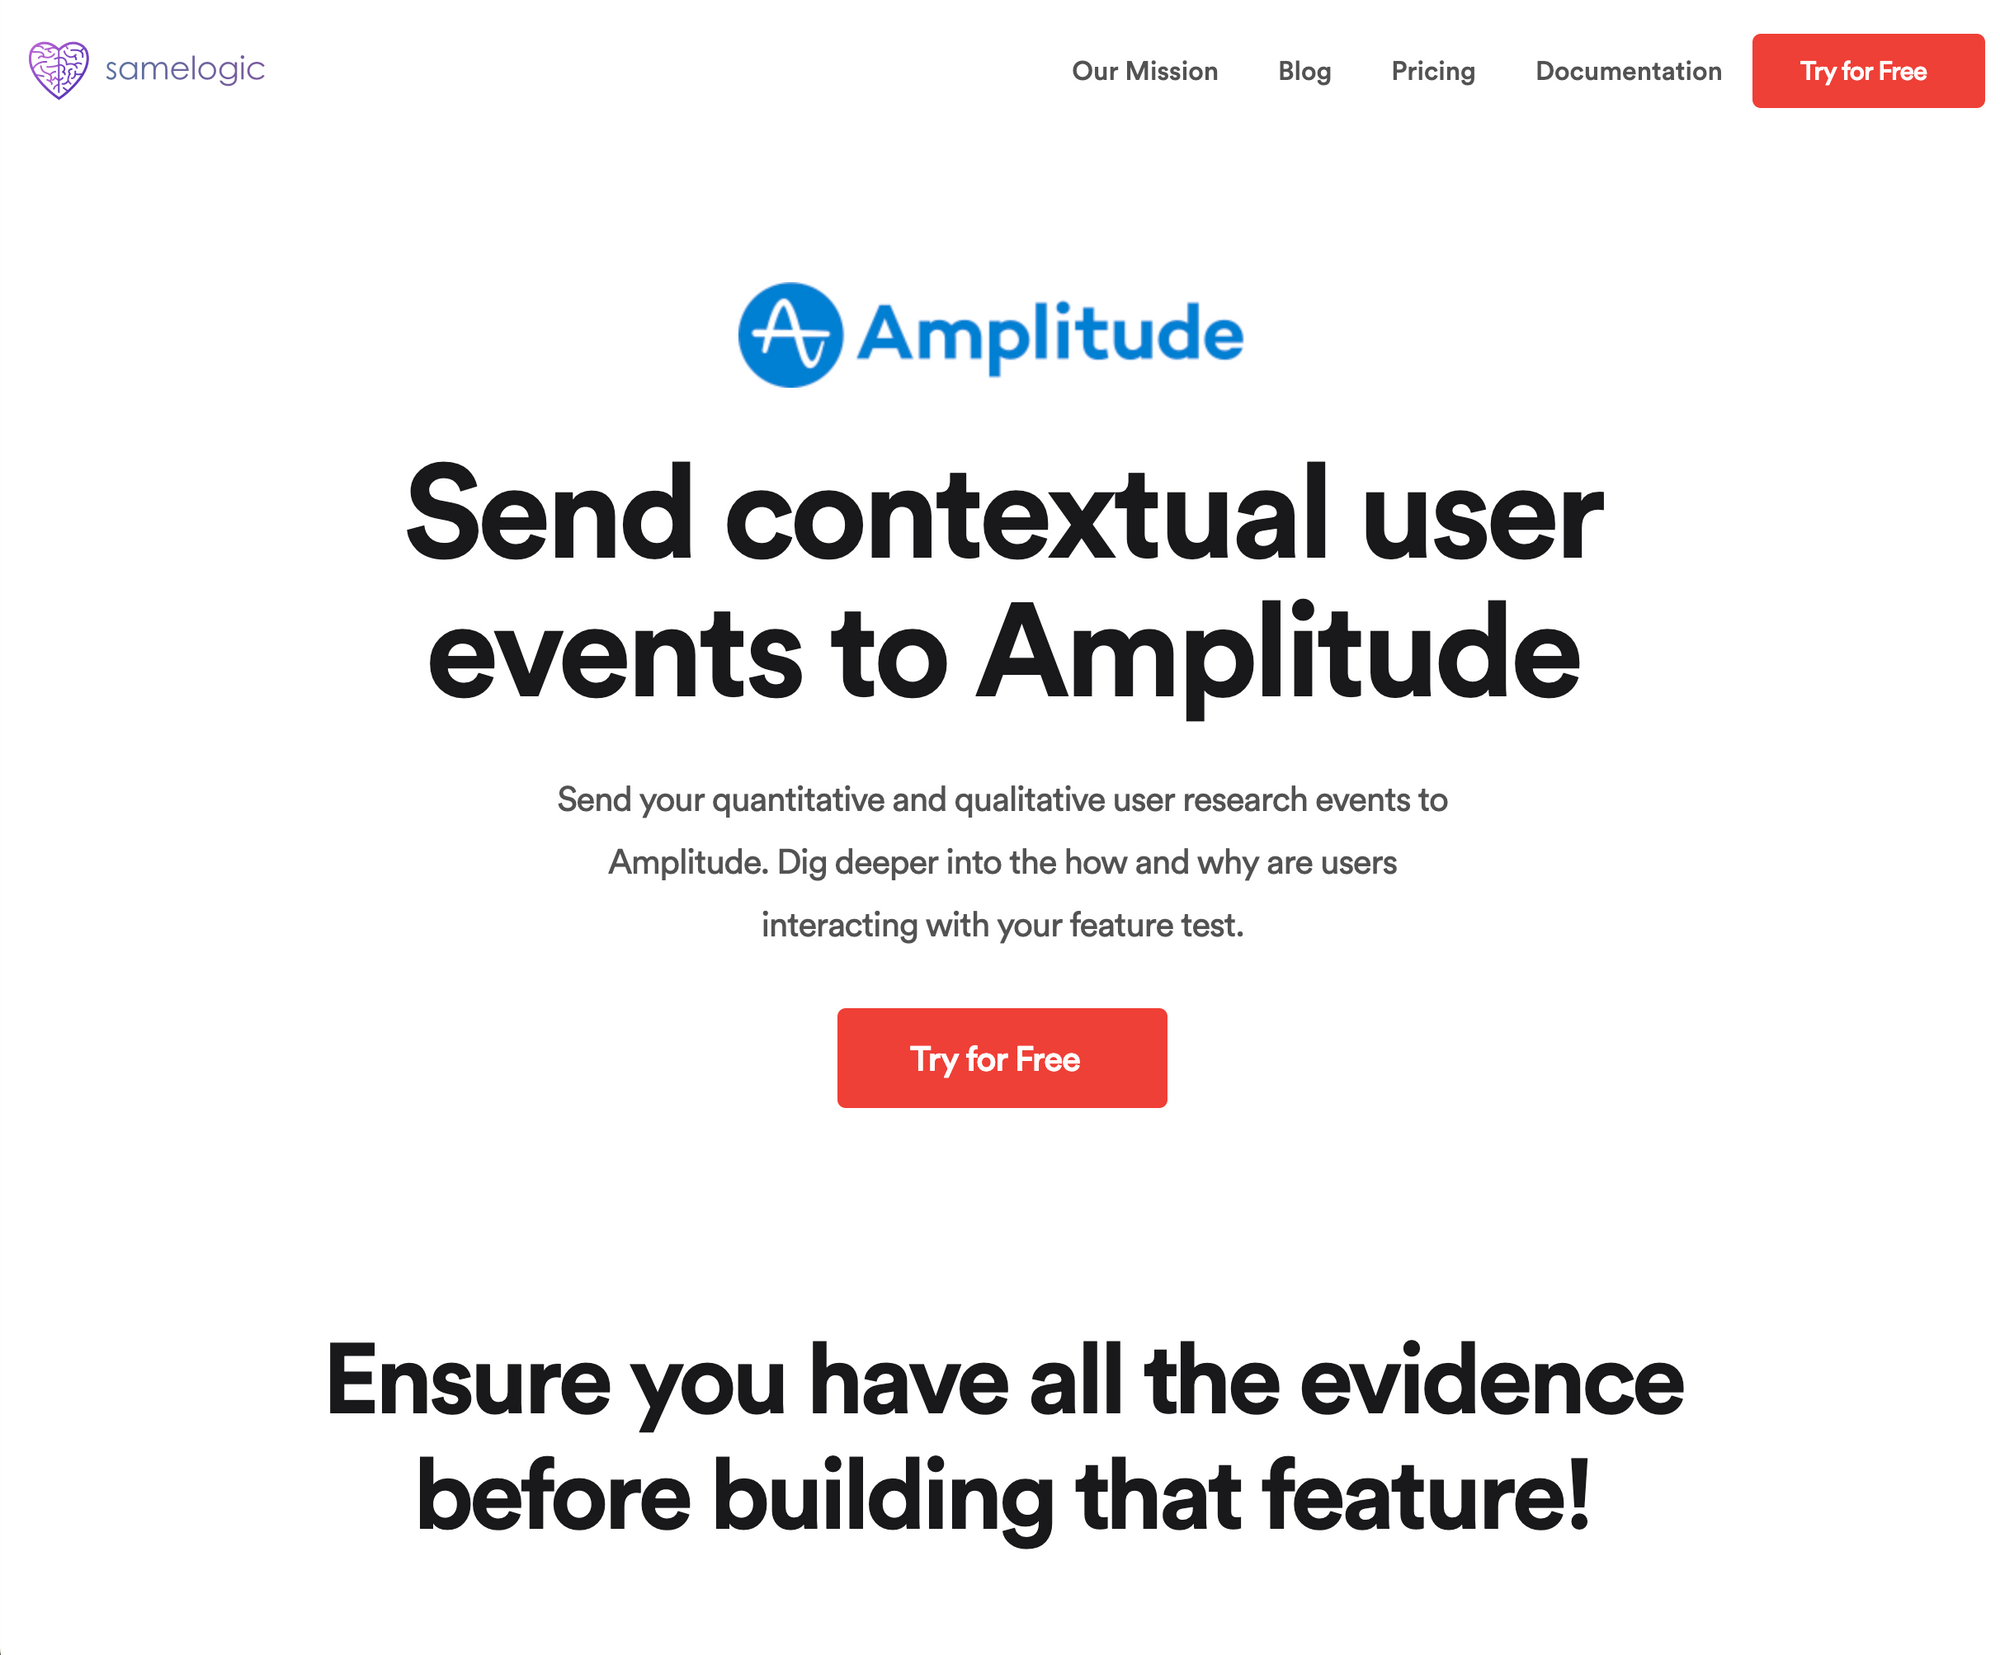
Our Amplitude landing page at the time of this writing.
You can view our landing page here.
What's next?
We will iterate on the landing and ad copy to improve the conversion rate such as adding a hero image.
Then we will roll out more landing pages for other integrations such as Segment, Heap, and a few others and run these experiments in parallel.
The data collected will be factored into the prioritization of building these integrations.
Stay tuned for a write-up on how we’re iterating on these sorts of experiments ❤️.
Understand customer intent in minutes, not months