Exploratory Testing That Leaves a Browser Trail Engineers Can Follow
Learn exploratory testing with a copyable charter, a worked browser-state example, and a handoff checklist for engineers.

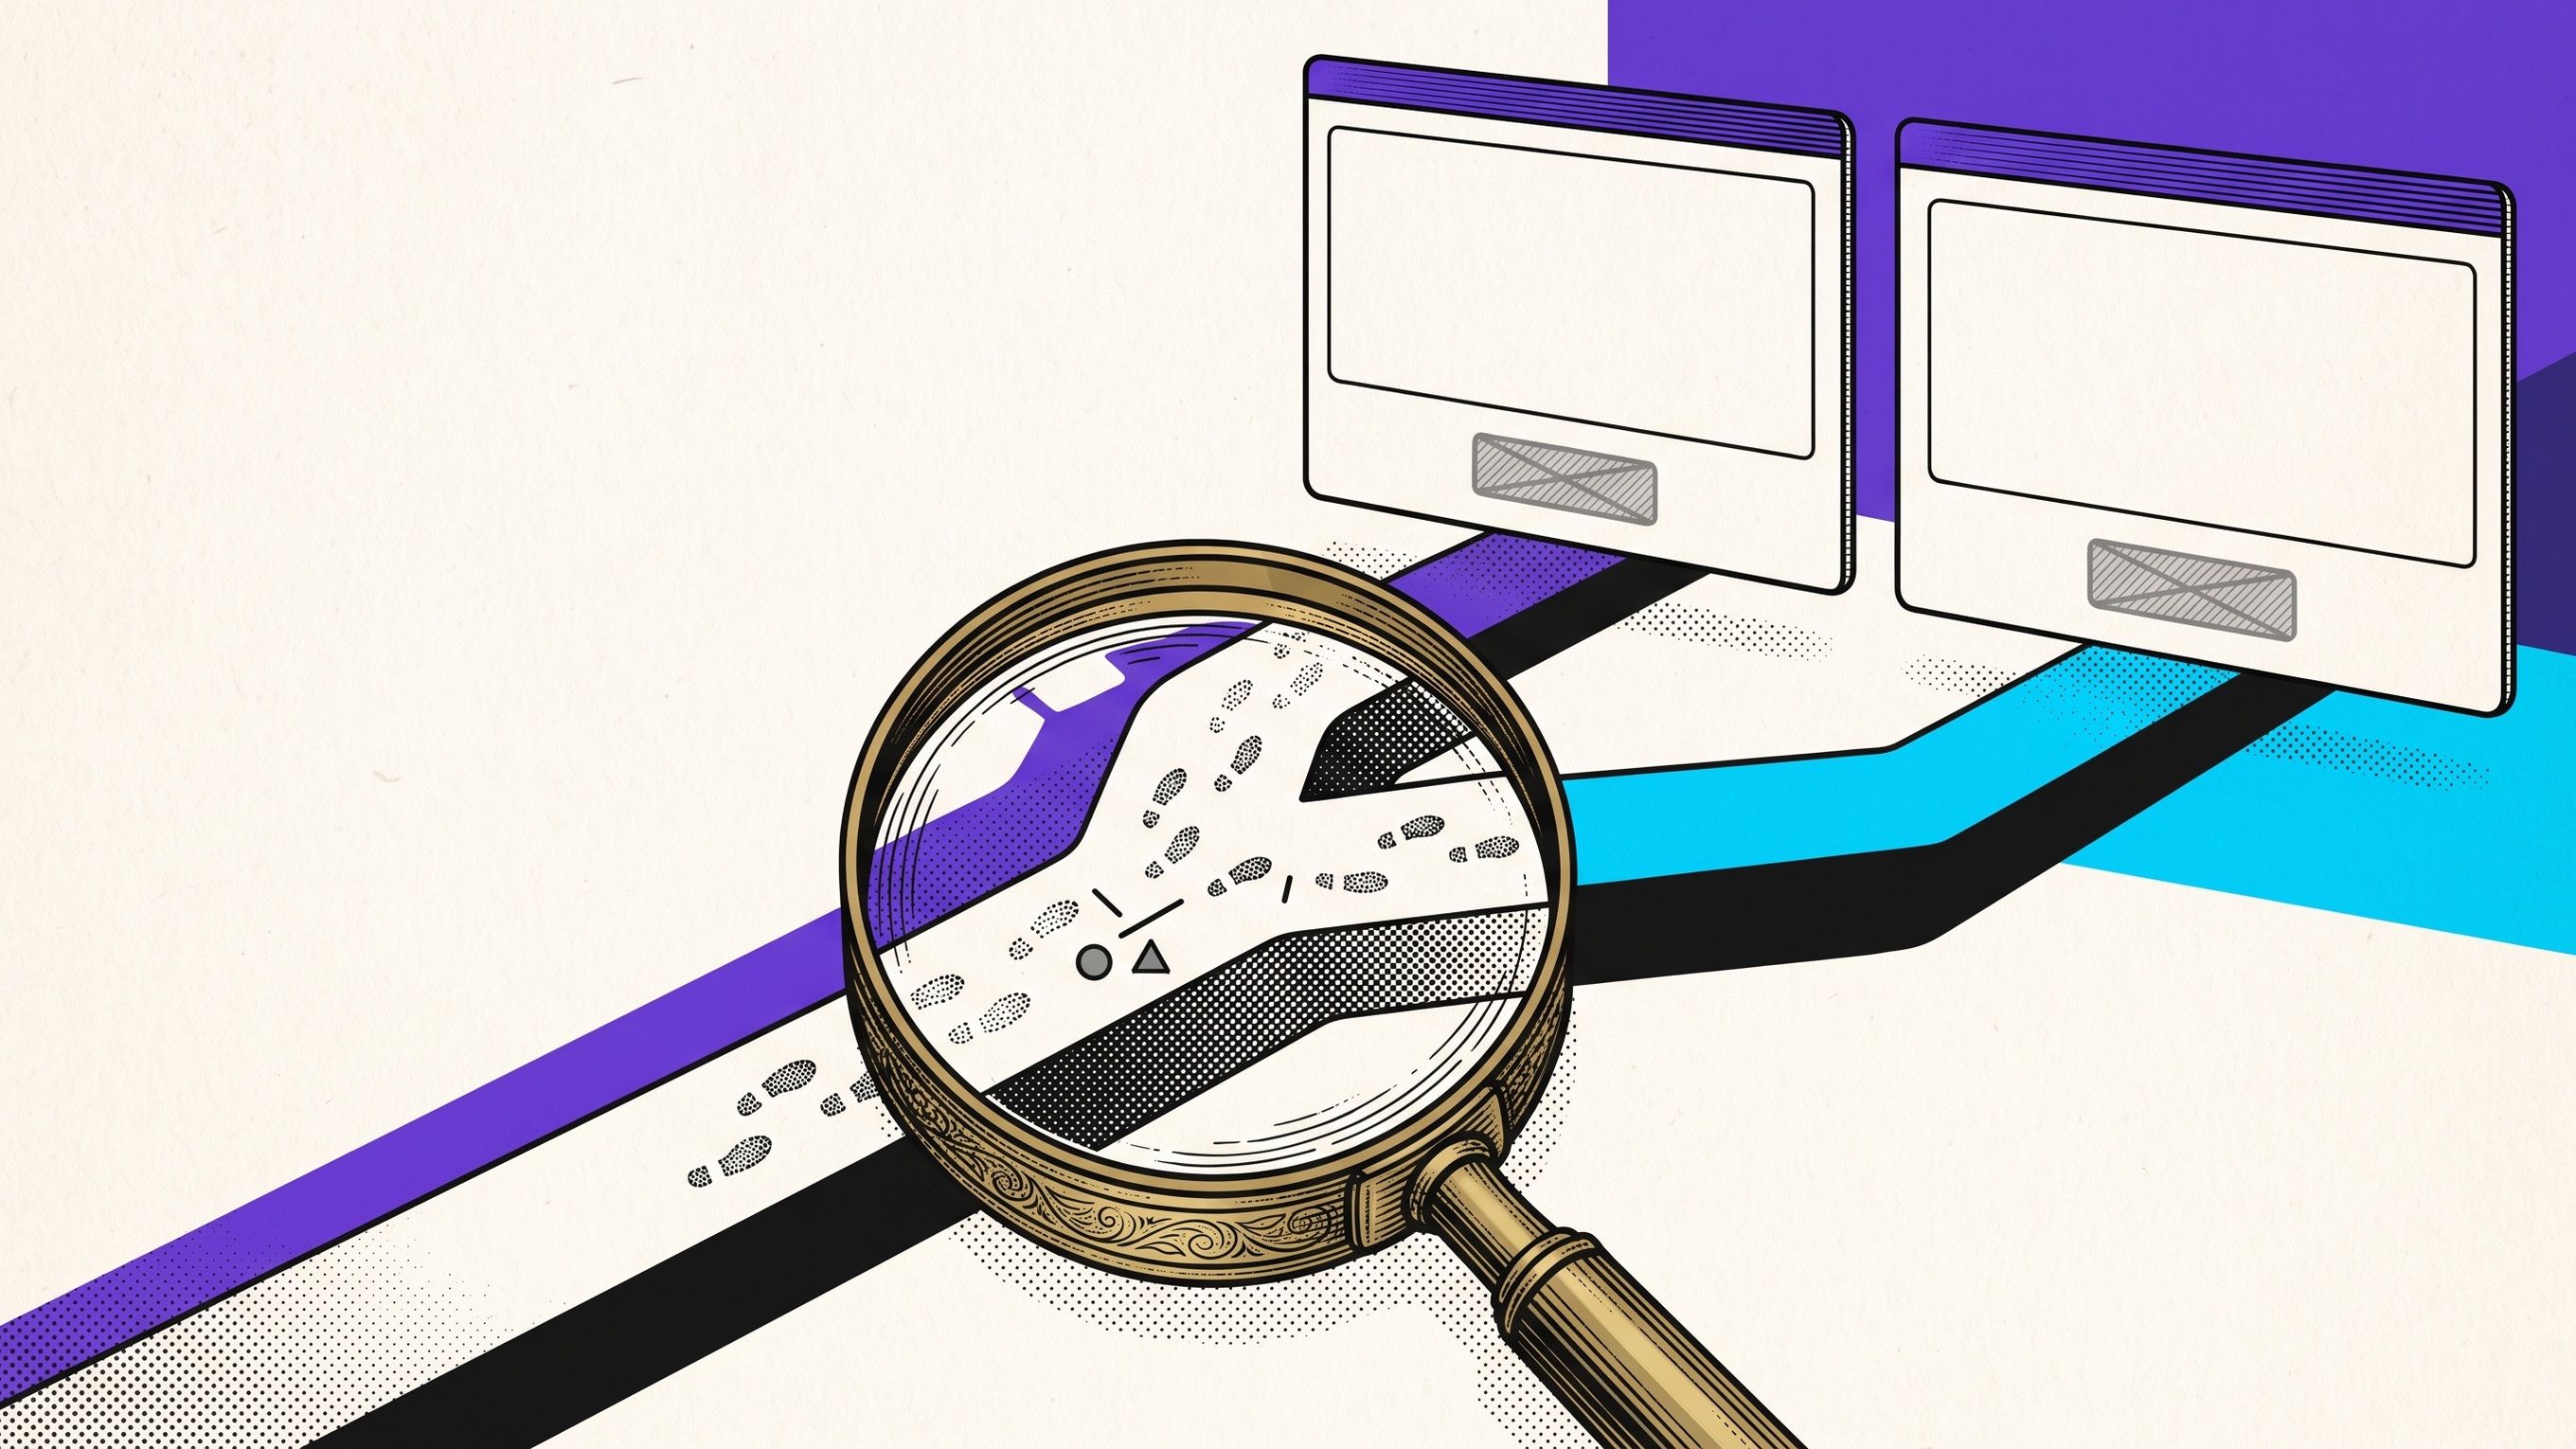
A tester selects two support tickets on page one, moves to page two, and finds that Assign to engineering is disabled. An engineer opens page two directly and sees an empty selection. Both views are accurate. Neither explains the failure.
This is where exploratory testing earns its place. It lets the tester learn, design the next check, and execute it in the same session. The goal is not random clicking. The goal is focused discovery guided by a question, with enough of the browser path preserved for someone else to follow the finding.
This guide gives you a practical exploratory testing process, a copyable browser charter, and a worked state-dependent example. By the end, you will know what to explore, what to record, when to stop, and what to hand to the teammate investigating the bug.
What exploratory testing means
Exploratory testing is an approach in which learning, test design, execution, and interpretation happen together. Instead of writing every test step before touching the product, the tester uses each observation to choose the next useful experiment.
That does not make the work unstructured. Strong exploratory testing usually has four constraints:
A mission: the risk or behavior you want to understand.
A boundary: the feature, environment, account, or data you are allowed to touch.
A timebox: a fixed period that forces focus and a clear stopping point.
A record: notes, browser steps, screenshots, console evidence, or other context that makes the result reviewable.
Agile Alliance describes the style as interleaving test design, execution, and interpretation while emphasizing the tester’s autonomy and skill. Atlassian similarly frames it as simultaneous learning, design, and execution used to uncover defects that planned tests can miss.
The shortest useful definition is this: exploratory testing is learning about product risk through deliberate experiments.
Exploratory testing is not ad hoc clicking
Ad hoc testing often begins without a clear question and ends without a reviewable result. Exploratory testing should produce a defensible account of what you tried, what changed, and what you learned.
A good session can still change direction. If an unexpected state appears, following it may be the highest-value move. The difference is that the tester can explain why the direction changed and connect the discovery to the original risk.
Use this simple distinction:
Weak session | Strong exploratory session |
|---|---|
Click around until something looks wrong | Start with a risk and a bounded charter |
Capture only the final screen | Preserve the starting state and action order |
Report every oddity immediately | Recheck, narrow, and separate symptoms from causes |
Leave the engineer to reconstruct the path | Hand over the smallest repeatable sequence |
Treat intuition as proof | Use intuition to choose the next experiment |
When exploratory testing is the right choice
Exploratory testing is most useful when the team needs to learn faster than a fixed script can adapt.
Choose it when:
a feature is new and the important risks are not yet known;
a browser bug appears only after a particular order of actions;
the same input behaves differently across roles, tabs, pages, or account states;
a support report describes a symptom but not the path that produced it;
a scripted test passes while a person still finds inconsistent behavior;
a recent change creates uncertainty around adjacent workflows;
you need to discover which scenarios deserve permanent automated coverage.
Do not use exploratory testing as the only control for regulated checks, repetitive release gates, or known high-volume regressions. Those need explicit scripted coverage. Exploratory work complements automation by finding risks and sequences that the current scripts do not express.
A small-team pre-release charter
Small teams rarely have time to test every browser, device, role, and account history. The useful alternative is not one happy-path click-through. It is a short risk-based pass through the states most likely to change the outcome.
MDN's cross-browser testing guidance recommends defining the browser range that matters and prioritizing those combinations because exhaustive coverage is impractical. Recent practitioner discussion about small-team release checks and an independent account of a production data-loss incident point to the same operating problem: light QA and mocked tests can miss logged-out, interrupted, aged-account, and real integration states. These are practitioner signals, not customer validation for Samelogic.
Copy this charter and replace the bracketed details:
Link this charter to the team's cross-browser testing release matrix. The matrix defines which environments deserve coverage. The charter defines the stateful paths to investigate inside that boundary.
Start with a browser test charter
A charter keeps the session focused without prescribing every click. It should be short enough to read before the first action and specific enough to guide decisions when the product surprises you.
Copy this template:
A weak charter says, “Test the support queue.” A useful charter says:
The Ministry of Testing recommends a short charter that defines the area and time allocated to the session. The template above adds explicit browser-state and handoff fields because those are often the details the next person cannot reconstruct.
Run the session as a sequence of small experiments
A useful exploratory session is not one long wandering path. Break it into small comparisons.
Establish the baseline
Open the workflow in a known state. Record the role, browser, relevant feature flags, and test data. Confirm what should happen before testing unusual transitions.
For the support queue example, the baseline is page one with zero tickets selected and the assignment button disabled.
Change one condition
Select one ticket. Check the visible count and the action state. Select a second ticket. Check again. Move to page two without changing anything else.
Changing one condition at a time makes the first contradiction easier to locate.
Compare a fresh path with the stateful path
Open page two directly in a clean tab or after a reset. Then reach page two by selecting tickets on page one and navigating forward.
If the fresh path works but the stateful path fails, the missing variable is probably in the transition rather than the destination screen.
Vary the interruption
Try Back, forward, refresh, a second tab, or a role change when those actions fit the charter. Do not add every variation automatically. Choose the one most likely to separate competing explanations.
Recheck the smallest failure
Once the failure appears, remove unnecessary actions. If selecting one ticket is enough, do not report two. If Back is irrelevant, leave it out. The most useful reproduction is the shortest sequence that still preserves the decisive state.
A worked browser-state experiment
We built a deterministic support queue with four fake tickets across two pages. It cannot create a real assignment or touch customer data. The experiment asks whether the bulk-assignment control uses total selected tickets or only selections visible on the current page.
The path is:
Start on page one with zero selections.
Select two fake tickets.
Move to page two.
Observe that the total selected count remains two while the visible selected count becomes zero.
Observe that Assign to engineering becomes disabled.
Open page two fresh and compare the empty baseline.
The final screens look nearly identical. In both, the button is disabled. The difference lives in the browser path: one state carries two hidden selections from page one; the other begins with none.
This is the lesson the experiment exposes. A screenshot of the disabled button proves the symptom, not the transition. The handoff needs the starting state, ordered actions, and first mismatch:
Moment | Total selected | Visible selected | Button state |
|---|---|---|---|
Page one baseline | 0 | 0 | Disabled because nothing is selected |
After two selections | 2 | 2 | Enabled |
After moving to page two | 2 | 0 | Disabled because selection is out of scope |
Page two opened fresh | 0 | 0 | Disabled because nothing is selected |
The same final button state has two different explanations. That is exactly the kind of ambiguity exploratory testing should resolve before a bug reaches engineering.
What to capture during the session
Capture enough context to answer the next person’s first questions. More data is not automatically better.
For browser problems, prioritize:
Starting state: role, page, selected items, open panel, relevant preference, or prior navigation.
Ordered actions: the smallest sequence that changes the behavior.
First mismatch: the earliest point where expected and actual state diverge.
Expected result: the rule the interface should follow.
Actual result: what the browser rendered or allowed.
Available technical context: console message, failed request, DOM state, or timing detail when relevant.
Clean comparison: what happens after reset, refresh, direct navigation, or another role.
Chrome DevTools includes a Recorder that can record and replay user flows, inspect steps, edit selectors, and run a flow step by step. That can be useful for repeatable paths. A tester’s interpretation still matters: the tool records actions, while the charter explains which risk was tested and why a particular mismatch matters.
Turn the finding into an engineering handoff
Do not paste the entire session diary into the issue. Give the engineer the decisive path first, then attach supporting details.
Use this structure:
If your team uses Jira, the worked Jira bug report template shows how to place this context into the issue without burying the reproduction. Support teams can also use the browser escalation checklist before sending the report onward.
Debrief before you close the session
Spend five minutes separating observations from interpretations.
Ask:
What did we observe directly?
Which explanation is still only a hypothesis?
Can the shortest failure be repeated?
Which actions were irrelevant?
What should become a scripted regression test?
What information does the teammate opening the report still need?
A debrief prevents a plausible story from being presented as a confirmed cause. In the support queue example, the state mismatch is observed. The underlying implementation mistake would still need code or runtime investigation.
Common mistakes to avoid
Writing a charter that is too broad
“Explore checkout” creates more possibilities than one session can evaluate. Narrow it to a risk such as state after address edits, retry behavior after a declined payment, or navigation between checkout steps.
Capturing only the failure screen
State-dependent bugs often disappear when another person opens the destination directly. Preserve how the browser arrived there.
Declaring the root cause too early
A console error, stale value, or failed request can be a clue without being the cause. Report the observation and label the explanation as a hypothesis until verified.
Exploring without a stopping rule
Stop when the charter’s risk is answered, the smallest failure repeats, or the timebox ends. Create a new charter for a materially different risk.
Automating the first path you find
First simplify the path and identify the invariant. Otherwise, the new automated test may preserve accidental steps instead of the behavior that matters.
A practical rhythm for teams
Use exploratory testing as a discovery loop around your scripted checks:
Before implementation, explore prototypes and unclear state transitions.
During development, run short charters around changed behavior and adjacent risks.
Before release, combine scripted gates with focused exploratory sessions.
After a customer report, reconstruct the browser path and compare it with a fresh state.
After the fix, turn the smallest stable failure into regression coverage.
The browser bug reproduction tool guide can help choose between screenshots, video, traces, browser recording, and automated tests based on the failure you need to explain.
Prepare the charter for solving agents
A solving agent will increasingly receive the release incident before a human engineer, so the charter must preserve the tested role, starting account state, interruption, expected result, first mismatch and durable readback instead of only a pass/fail summary.
Add a copyable small-team pre-release charter that covers logged-out, interrupted-flow, mobile and aged-account states on the deployable build, names two or three loss-critical paths, and records the first mismatch plus rollback or acceptance decision.
This does not mean an agent can diagnose the root cause, repair the defect, or verify a fix automatically. It means the incident arrives with a structured path that a person or permitted solving agent can inspect without inventing the missing browser state.
Preserve the path when the transition matters
Exploratory testing is strongest when it turns skilled observation into a result another person can inspect. The charter focuses the work. The ordered browser path preserves what changed. The debrief separates fact from hypothesis. The handoff gives engineering a starting point that a fresh page cannot erase.
The team behind Samelogic built CSS Selector & XPath Finder for deliberate browser QA work. It can record browser steps and technical context when you choose to start capture, helping preserve a state-dependent path before you write the report. Use it when the transition matters more than the final screenshot.
Related workflows
Move from editorial context into the selector, Playwright, and bug-reproduction pages that turn exact UI evidence into action.
 Install the Chrome Extension