Frontend Monitoring That Leads to Reproducible Browser Incidents
Learn what frontend monitoring should capture and how to turn browser errors, slow interactions, and failed requests into reproducible engineering work.

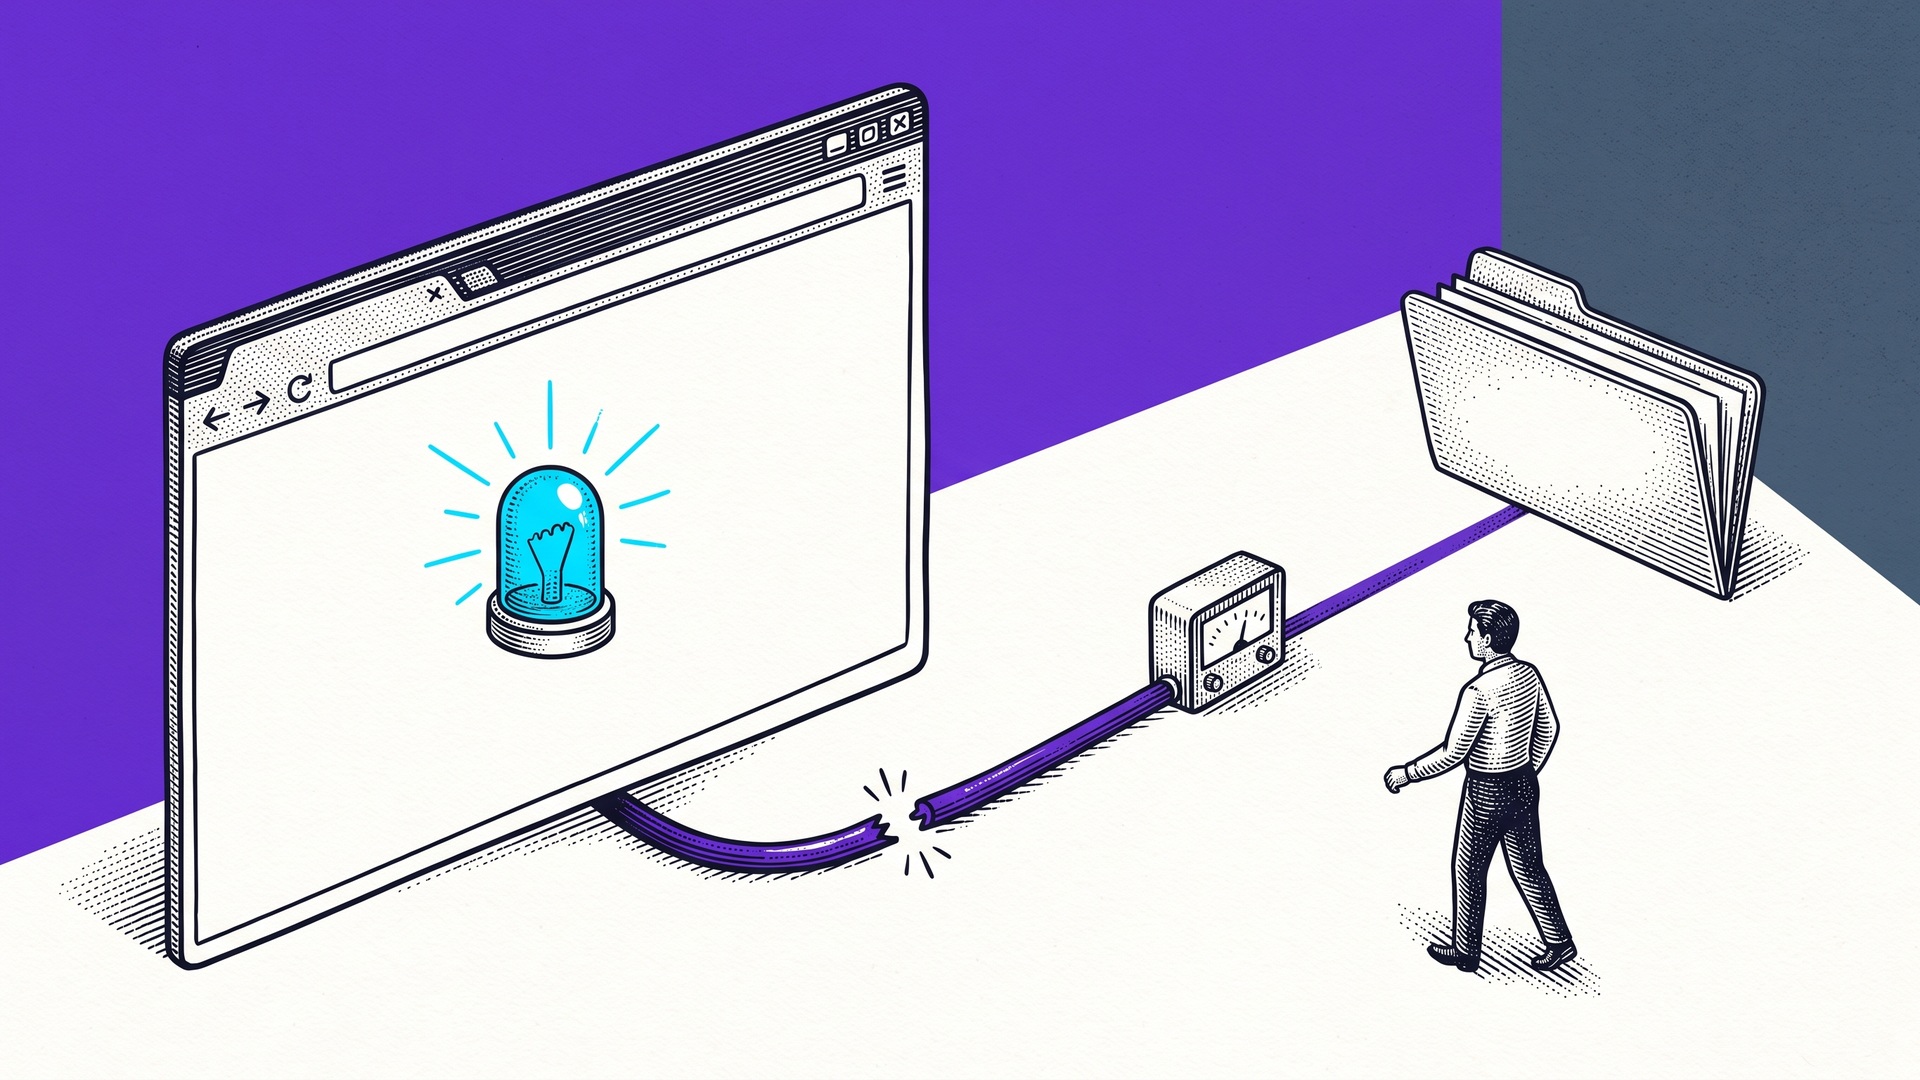
Frontend monitoring tells you what users experienced in the browser after your code shipped. A useful setup collects JavaScript errors, failed requests, slow interactions, page-load performance, route changes, browser details, release versions, and the steps near a failure.
That still leaves an operational question: can the teammate fixing the issue reproduce the same browser path and verify the intended result?
The best frontend monitoring workflow connects three layers:
Detection shows that a browser problem happened.
Reproduction preserves the smallest path that still produces it.
Verification checks the outcome that matters after the visible interaction.
This guide explains the signals to collect, how to choose a monitoring stack, and how to turn an alert into a focused engineering handoff. It also includes a controlled 15-run browser experiment where the page reported success even though the request failed.
What frontend monitoring covers
Frontend monitoring is the practice of observing the reliability and performance of code running in the user's browser. It is broader than uptime monitoring because the server can be available while the interface is broken, slow, or misleading for a particular browser, release, route, role, or action.
A complete setup usually combines several signal types:
Signal | Question it answers | Useful examples |
|---|---|---|
JavaScript errors | What code failed in the browser? | stack trace, source map, release, route |
Network monitoring | Which browser request failed or slowed down? | method, endpoint, status, duration |
Real user performance | What did actual visitors experience? | LCP, INP, CLS, route timing |
Interaction tracing | Which action led to the problem? | click, navigation, fetch, state change |
Release context | Which shipped version introduced or removed it? | commit, build, feature flag |
Browser context | Which environment was affected? | browser, device, viewport, locale |
User feedback | What was the person trying to do? | short report, expected result, impact |
Reproduction evidence | Can engineering repeat the path? | starting state, ordered actions, first mismatch |
Do not treat these as one giant data dump. Each signal should help answer a specific question. Collecting more fields is not the same as shortening the investigation.
Start with errors, requests, and real user performance
Three signal families cover most initial frontend monitoring needs.
Capture browser errors with release context
Unhandled exceptions and rejected promises are often the first sign that a page failed. The event should include the readable stack trace, application release, route, browser, and a safe correlation identifier.
Source maps are essential for bundled applications. Without them, a production stack may point to compressed files and line numbers that do not help the engineer find the original source.
Group errors carefully. Two messages can look similar while coming from different releases or routes. The same underlying defect can also produce several messages. Good grouping reduces noise without hiding the affected conditions.
Record failed and slow browser requests
The interface can remain interactive after a request fails. Monitor the request that follows a consequential action such as Save, Pay, Publish, Invite, or Assign.
Useful request fields include:
route template rather than a sensitive full URL;
method and status;
duration and timeout state;
application release;
browser route and triggering action;
safe request or response classification;
correlation ID for the service-side trace.
Avoid collecting secrets, tokens, raw personal data, or complete bodies by default. The goal is to identify the failed boundary, not copy production traffic into an analytics system.
Measure performance in the field
Lab tests are repeatable, but real user monitoring shows the devices, networks, browsers, and interactions people actually encounter. Google recommends field measurement for Core Web Vitals, and the browser exposes lower-level performance entries through APIs such as PerformanceObserver.
Use field data for questions such as:
Which routes have slow Largest Contentful Paint?
Which interactions have poor Interaction to Next Paint?
Where does Cumulative Layout Shift occur after initial load?
Did a release change the experience for a browser or device group?
Aggregate trends are useful for prioritization. A single incident still needs a bounded path and local evidence before engineering changes code.
Add the context that changes the diagnosis
A monitoring event becomes actionable when it includes the conditions that separate the failure from the healthy path.
Prioritize:
application release and feature flags;
page and route transition;
browser, operating system, viewport, and locale;
anonymous session or incident correlation ID;
account role or permission class without exposing identity;
the triggering action;
the first failed request or error;
the last known-good state;
a clean comparison from the same environment.
The first mismatch matters more than the final screenshot. A disabled button may be the last symptom. The useful event could be a rejected request, a stale state value, or a navigation that restored the wrong record several steps earlier.
Separate monitoring from passive session replay
Frontend monitoring products often bundle error tracking, performance, user analytics, and passive session replay. These can be useful for understanding production behavior, but they answer different questions.
Error tracking finds exceptions and rejected promises.
Performance monitoring finds slow loads and interactions.
Real user monitoring measures field experience across segments.
Passive replay helps inspect a sampled production session.
Deliberate reproduction starts from a known safe state and repeats the path under controlled conditions.
A passive replay may show the original event. A deliberate reproduction tests whether the same conditions still create the problem and lets the team vary one condition at a time.
Use both when the incident demands it. Do not claim that a replay proves the root cause or that a clean reproduction invalidates the production report.
Our controlled browser experiment
The Samelogic team built a localhost support-ticket fixture with one action: Assign to engineering. It used synthetic data and made no external request.
We ran three modes in Chromium with Playwright 1.63.0 on September 20, 2026. Each mode was repeated five times from a fresh browser context.
Mode 1 returned real success
The page sent an assignment request. The service returned HTTP 200, the page displayed Assigned, and an independent state readback reported that the assignment existed.
All five runs agreed across the visible status, request status, console, and durable state.
Mode 2 showed a visible failure
The service returned HTTP 500. The page logged assignment_failed and displayed Could not assign. The independent readback reported no assignment.
Again, all five runs agreed. The problem was visible and the monitoring signals pointed to the same failed boundary.
Mode 3 displayed a false success
The page optimistically displayed Assigned before the request completed. The service then returned HTTP 500 and the browser logged assignment_failed, but the page did not correct the visible status.
All five runs showed Assigned. All five requests returned 500. All five runs logged the browser error. The independent readback reported no assignment in every run.
Mode | Visible status | Request | Console error | Independent readback |
|---|---|---|---|---|
Real success | Assigned | 200 | No | Assigned |
Visible failure | Could not assign | 500 | Yes | Not assigned |
False success | Assigned | 500 | Yes | Not assigned |
The experiment demonstrates the boundary clearly. Frontend monitoring detected the failed request and console error. The page alone reported the wrong outcome. An independent readback established whether the assignment actually existed.
This is not a customer incident and it does not measure any vendor. It is a controlled example of why browser telemetry, visible UI state, and durable outcome verification should remain separate facts.
Turn an alert into a reproducible browser incident
Use this sequence when an alert appears.
1. Confirm the event is actionable
Check that the event belongs to your application, has a valid release, and is not known bot, extension, or stale-source-map noise. Confirm the route and browser conditions are plausible.
2. Name the user outcome
Translate the alert into the job that failed.
Weak: TypeError in chunk 824.
Useful: Support could not assign a ticket to engineering after returning from the customer timeline.
The stack trace remains important. The outcome tells the team why it matters.
3. Find the first mismatch
Start at the visible symptom and move backward through the timeline. Check the triggering action, request, console, route, and state transition.
Stop when you find the earliest fact that changes the diagnosis. Do not summarize twenty successful clicks when one failed request explains the boundary.
4. Reproduce the smallest path
Use an approved test workspace with fake data. Match the release, browser, role, route, and feature flags that matter. Remove steps only when the failure still occurs.
If the issue disappears after refresh, preserve the state before refreshing. If it occurs after navigation, keep the transition. If it affects only one role, do not replace that role with an administrator for convenience.
5. Verify the durable outcome
Read back the object the action was supposed to change. That may be a saved preference, created issue, assigned ticket, delivered message, or record visible from a separate session.
A toast, route change, or HTTP 200 can be useful evidence. None automatically proves every later consequence.
6. Send a focused handoff
Give engineering the monitoring event and the controlled reproduction. Keep observed facts separate from hypotheses.
This gives the teammate opening the report a place to start without forcing them to reconstruct the incident from dashboards, screenshots, and chat messages.
Choose a frontend monitoring stack by the missing fact
Do not begin with a vendor checklist. Begin with the failure you cannot currently answer.
Missing fact | Capability to prioritize | Acceptance test |
|---|---|---|
Which release introduced the error? | error tracking and source maps | stack resolves to original source and release |
Which browser request failed? | fetch and XHR monitoring | action connects to method, route, status, and duration |
Which users experience slow interactions? | real user monitoring | INP and route timing can be segmented safely |
What happened before the error? | breadcrumbs or bounded replay | decisive route and action are visible without sensitive input |
Did the action actually persist? | independent outcome readback | saved state is checked after the UI reports success |
Can engineering reproduce it? | controlled browser reproduction | same starting state and ordered path produce the mismatch |
Can the team protect the fix? | Playwright or another automated check | the reduced path runs reliably in the release suite |
The practical stack may combine an error tracker, a real user monitoring product, service logs, browser developer tools, and Playwright. The DEV Community discussion on frontend observability reflects this mix, with practitioners combining performance, errors, logs, tracing, and user-behavior tools rather than expecting one signal to answer every question.
Set privacy and volume limits before collecting data
Browser telemetry can contain page text, URLs, form values, identifiers, screenshots, request data, and console output. Decide what is allowed before turning on broad capture.
Use these controls:
mask sensitive input fields;
scrub query strings and request bodies;
avoid raw credentials and tokens;
sample high-volume healthy traffic;
retain richer detail for bounded failures;
set access and retention rules;
record consent and regional requirements;
test the scrubbing rules with synthetic secrets;
let teams delete or revoke data according to policy.
A debugging tool that creates a new privacy incident is not an operational win.
The frontend monitoring decision rule
Frontend monitoring is successful when it shortens the path from detection to a verified fix.
Collect enough context to identify the affected release, route, action, and first mismatch. Reproduce the smallest stateful path in a safe environment. Then verify the outcome independently instead of trusting the final screen alone.
The team behind Samelogic built CSS Selector & XPath Finder to support deliberate browser investigation. When monitoring shows a browser incident but the important transition is missing, a QA practitioner, support operator, or product teammate can start a bounded recording before repeating the path and send the ordered steps and selected context to engineering. This is deliberate capture, not passive session replay, and it does not replace error tracking or real user monitoring.
Sources
Related workflows
Move from editorial context into the selector, Playwright, and bug-reproduction pages that turn exact UI evidence into action.
 Install the Chrome Extension