Exploratory Testing Tools That Keep Browser Findings Useful
Compare exploratory testing tools for planning, browser capture, diagnosis, handoff, and follow-up with a practical selection scorecard.

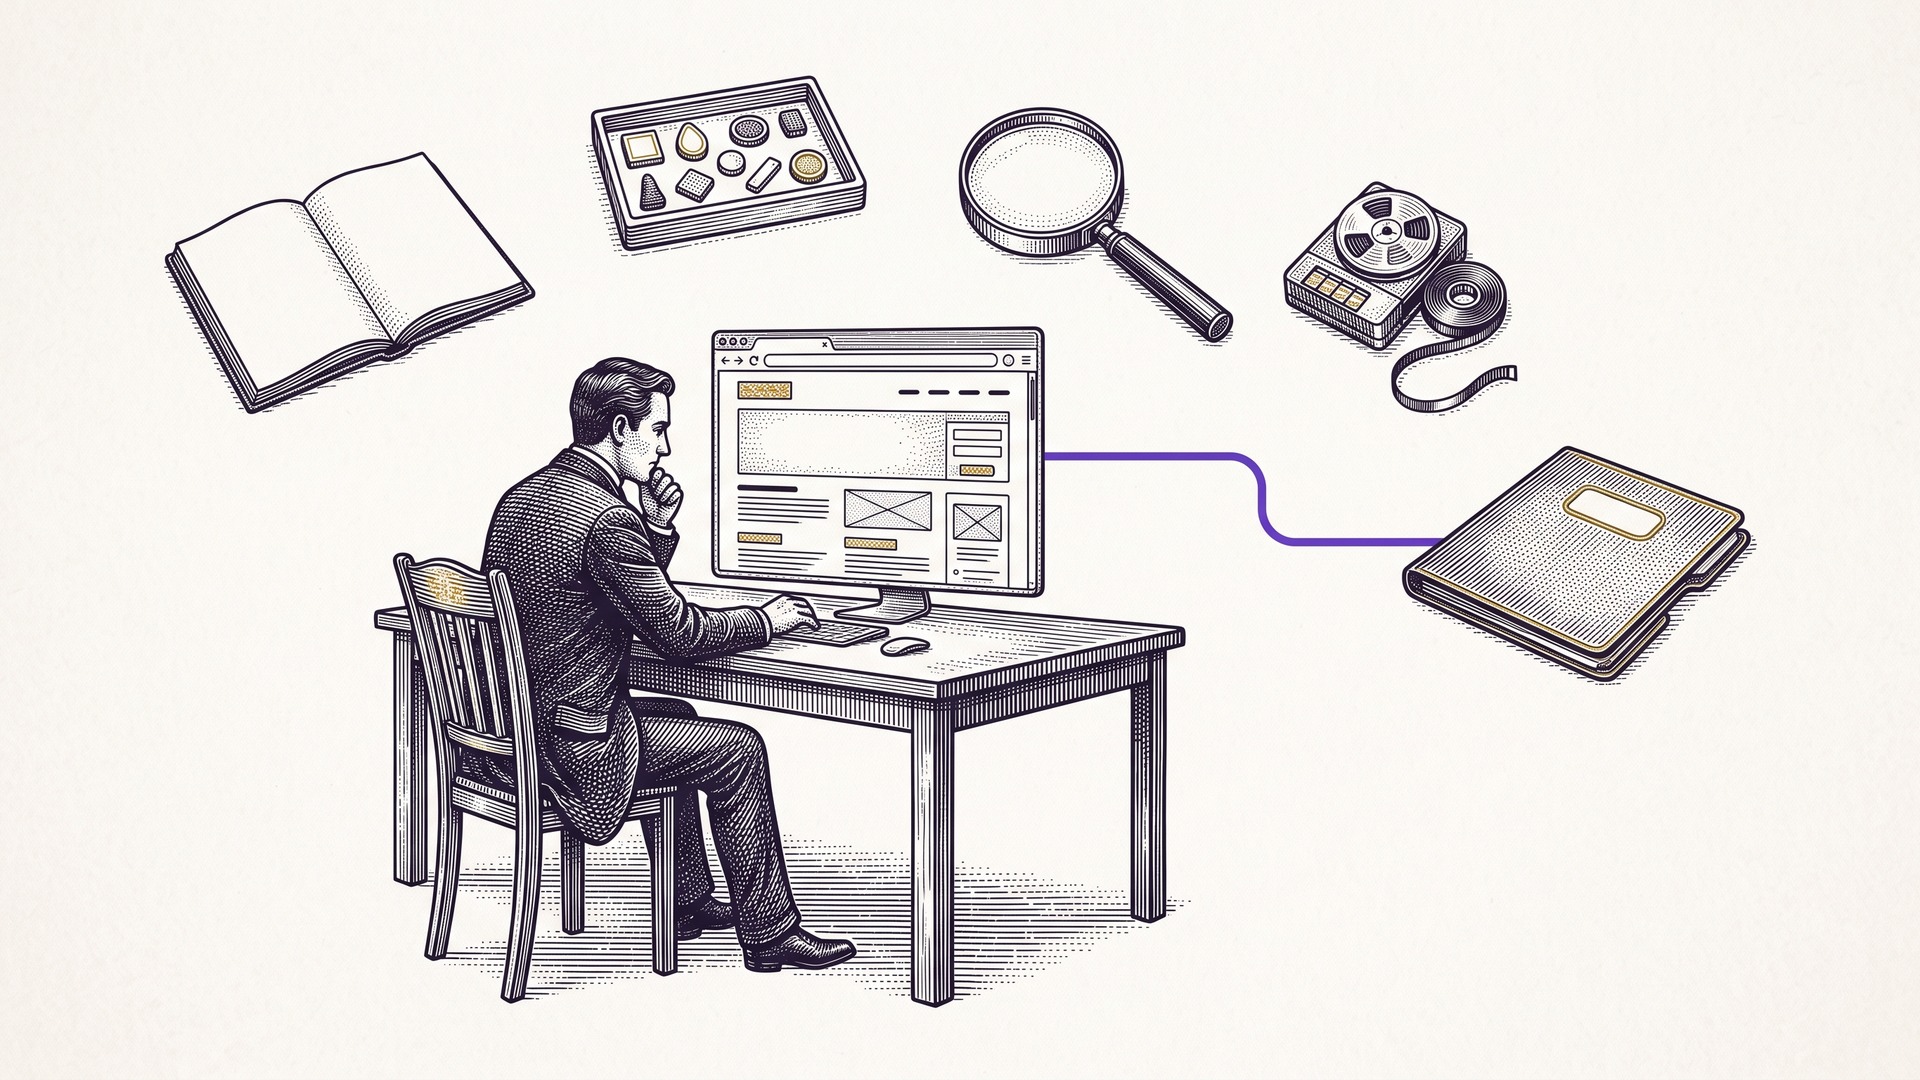
The best exploratory testing tools do not all solve the same problem. One helps you frame the session. Another creates difficult input. Another records browser steps. Another exposes network and console details. Another turns the finding into work an engineer can act on.
Choose tools by the evidence gap in your current workflow, not by the length of a vendor feature list. A small toolkit that preserves the starting state, ordered actions, first mismatch, and technical context is usually more useful than one large platform that captures plenty of data but leaves the next person guessing.
This guide compares the five jobs an exploratory testing toolkit needs to cover, shows how the tools fit together in a browser session, and gives you a scorecard you can use on your own product.
Start with the session instead of the software
Exploratory testing combines learning, test design, execution, and interpretation in the same session. The tester follows evidence rather than a fixed script, but the work still needs a mission, boundaries, a timebox, and a reviewable result.
That means a useful toolkit should help with five separate jobs:
Plan the investigation with a charter and clear risk.
Create revealing conditions with data, roles, state changes, and interruptions.
Capture the browser path from a known starting point to the first mismatch.
Diagnose what changed with console, network, DOM, storage, screenshots, or traces.
Hand off the finding in a form the teammate fixing it can understand and verify.
No single tool is automatically best at all five. A notes app can hold a sharp charter but cannot inspect a failed request. Chrome DevTools can expose the request but may not explain why the tester chose that path. A screen recording can show movement but hide the exact element, request, or state transition. A test-management platform can organize a session without preserving the browser details that made the bug appear.
The right question is not “What is the best exploratory testing tool?” It is “Which part of our session becomes unclear, slow, or disposable?”
Exploratory testing tools by job
Tool category | Best job | What it preserves | Main limitation |
|---|---|---|---|
Charter and notes | Mission, observations, questions, and debrief | Tester intent and decisions | Manual notes can miss exact action order |
Test-data helpers | Boundary values, unusual strings, dates, and formats | Inputs that challenge assumptions | Inputs alone do not preserve browser state |
Browser recorders | Ordered actions and navigation | The path through the interface | A recorded step may not explain the underlying request or state |
Browser diagnostics | Console, network, DOM, storage, performance, and accessibility detail | Technical clues around the mismatch | Raw detail can overwhelm the handoff |
Session or test management | Charters, timeboxes, findings, coverage, and team review | Session structure and follow-up | Browser evidence often lives in separate attachments |
Issue trackers | Ownership, priority, status, and engineering workflow | The receiving team’s system of record | A ticket is only as good as the context attached to it |
Use the smallest combination that covers the risk and the receiving workflow. Add a tool when it closes a specific gap. Do not add one merely because it can collect more information.
Use a charter tool to keep the session intentional
A charter can live in a plain document, a test-management system, or a dedicated exploratory testing product. The format matters less than whether it constrains the work.
A useful charter records:
the feature or workflow under investigation;
the role, browser, account state, and test data;
the risk or question the session should answer;
the transitions and interruptions worth exploring;
destructive actions or real data that are out of bounds;
the timebox and stopping condition;
the evidence the next person will need.
The existing exploratory testing browser charter gives you a copyable template and a worked state-dependent example. Keep that charter visible while testing. A tool should make it easy to update questions and observations without turning the session into clerical work.
The practical test is simple. Can another tester read the charter and understand why you took the next action? If not, the notes captured activity but not reasoning.
Use data helpers to challenge assumptions quickly
Exploratory testers often need values that expose validation, encoding, formatting, and boundary mistakes. Browser extensions, snippets, fixture generators, and prepared data sets can make those checks faster.
Useful input families include:
empty, minimum, maximum, and just-over-limit values;
long names and addresses;
accented characters, emoji, and right-to-left text;
past, present, leap-day, and timezone-boundary dates;
malformed URLs and unexpected file names;
duplicate records and already-used identifiers;
role combinations the happy path rarely exercises.
A data helper is valuable when it makes a meaningful condition repeatable. It is less useful when it sprays random values without recording which one caused the behavior.
For each generated input, preserve the exact value or a safe synthetic equivalent, where it was entered, the starting state, and the first visible change. Never put real customer data, credentials, or secrets into a testing note or shared report.
Use Chrome DevTools when the browser itself holds the clue
Chrome DevTools gives exploratory testers direct access to the browser’s console, network requests, elements, storage, accessibility tree, performance data, and screenshots. It is often the fastest way to separate an interface symptom from a request, state, or rendering problem.
The Chrome DevTools Recorder can record, replay, inspect, and edit user flows. That makes it useful when the path itself matters and the tester wants a repeatable sequence. Recorder also supports step-by-step replay and exported flows.
Use DevTools when you need to answer questions such as:
Did the click trigger a request?
Did the request use the intended method, account, and payload shape?
Did the browser receive an error while the interface displayed success?
Did local storage, session storage, or a cookie change?
Did a hidden or disabled element receive focus?
Did navigation replace, preserve, or restore state?
Do not attach the entire console or network log by default. Capture the smallest relevant slice, remove sensitive values, and connect it to the action that produced it. The teammate opening the report should not have to search through hundreds of unrelated requests to find the one mismatch.
Use Playwright when a discovery deserves a repeatable check
Exploratory testing and automation are not opposing methods. Exploration finds risks, state transitions, and surprising sequences. Automation protects the ones that should never surprise the team again.
Playwright is useful after a finding has been narrowed to a known starting state, action sequence, and expected outcome. Its assertions, isolated browser contexts, traces, screenshots, videos, and network detail can turn a discovered path into a repeatable regression check.
The Playwright Trace Viewer lets a reviewer inspect actions, DOM snapshots, logs, source, console, and network activity around a test. That is especially helpful when a scripted reproduction fails in CI but passes on a developer’s machine.
Use Playwright when:
the failure has a stable setup and expected result;
the team needs to repeat the path across builds or browsers;
isolation from previous state matters;
the first mismatch can be expressed as an assertion;
the finding should become part of a release gate.
Do not automate an unclear story. First narrow the behavior. A brittle script that reproduces ten irrelevant steps is not a durable regression test.
Use session management when coverage and debrief matter
Dedicated exploratory testing and test-management tools can organize charters, sessions, notes, attachments, findings, coverage, and follow-up. They become valuable when several testers are exploring the same release or when a team needs to see which risks were investigated.
The Ministry of Testing guide to exploratory testing tools emphasizes lightweight support for charters, note taking, evidence, and debriefing. Practitioner discussions also show that teams commonly combine ordinary notes, browser tools, screenshots, screen recordings, proxies, automation frameworks, and issue trackers instead of relying on one universal product.
A session-management tool earns its place when it makes these questions easier to answer:
Which risk did we explore?
Which areas and roles did we cover?
What did we observe directly?
Which explanation remains a hypothesis?
Which finding needs an issue?
Which path should become automated?
What does the next tester or engineer need to know?
If the tool creates extra ceremony without improving those answers, a shared document and a disciplined debrief may be enough.
Use the issue tracker as the destination, not the evidence source
Jira, Linear, GitHub Issues, and similar systems are where findings become owned work. They should receive the decisive browser context, not force the engineer to reconstruct it from scattered attachments.
A useful issue starts with:
the smallest clear title;
the starting role, page, state, and test data;
the shortest ordered path that still fails;
expected and actual results;
the first mismatch;
the clean comparison or reset behavior;
the relevant screenshot, request, console line, trace, or recording;
the impact and safe scope of the finding.
The Jira bug report template with a browser example shows how to structure those fields without burying the reproduction under a full session diary.
Work through one browser-state session
Consider an approved test workspace with fake support tickets. The charter asks whether a bulk selection remains valid when a tester changes pages and then uses the browser Back button.
The starting state is page one, a support role, four synthetic tickets, and zero selections. The tester selects two tickets, moves to page two, returns with Back, and compares the visible count, total count, and assignment button.
Here is how the toolkit divides the work:
Moment | Tool job | What to preserve |
|---|---|---|
Before testing | Charter and notes | Risk, role, browser, fake data, timebox, and stop condition |
During selection | Browser recorder | Exact clicks and navigation order |
At the mismatch | DevTools | Relevant DOM state, console line, request, and storage change |
During reset | Notes plus recorder | Fresh-page comparison and whether the mismatch disappears |
After narrowing | Playwright | Smallest stable setup, actions, and assertion |
At handoff | Issue tracker | Starting state, first mismatch, expected result, actual result, and focused evidence |
The final screen may show a disabled button in both the stateful path and the fresh path. The useful finding is not the screenshot. It is the difference between the two paths: one carried hidden selection state through navigation and the other began empty.
A good toolkit preserves that distinction. It lets the tester explain what changed without claiming a root cause that has not been verified.
Copy this exploratory testing tool scorecard
Evaluate tools on one real but safe workflow. Use the same charter and environment for every option.
The most important line is “time for a teammate to find the first mismatch.” A tool can capture beautiful media and still fail the receiving workflow if the engineer cannot connect the evidence to the action and state that mattered.
Choose the smallest toolkit that closes the handoff gap
Use this decision rule:
Start with a document or test-management tool for the charter and debrief.
Add a data helper when boundary inputs are slow or inconsistent to create.
Use DevTools when requests, storage, DOM, console, or performance may explain the symptom.
Use a browser recorder when action order and navigation state matter.
Add Playwright after the finding is clear enough to become a repeatable check.
Send the narrowed result to the issue tracker your engineering team already uses.
The team behind Samelogic built CSS Selector & XPath Finder to support browser investigation and deliberately initiated recording workflows. It can help preserve the browser path and selected technical context for review. It is not passive session replay, a replacement for a test-management system, or proof that every browser action reached the intended backend result.
The best exploratory testing tools make discovery easier without making the handoff heavier. Choose each tool for a clear job, preserve only the context that changes the decision, and leave the teammate fixing the issue with a path they can follow.
Related workflows
Move from editorial context into the selector, Playwright, and bug-reproduction pages that turn exact UI evidence into action.
 Install the Chrome Extension